

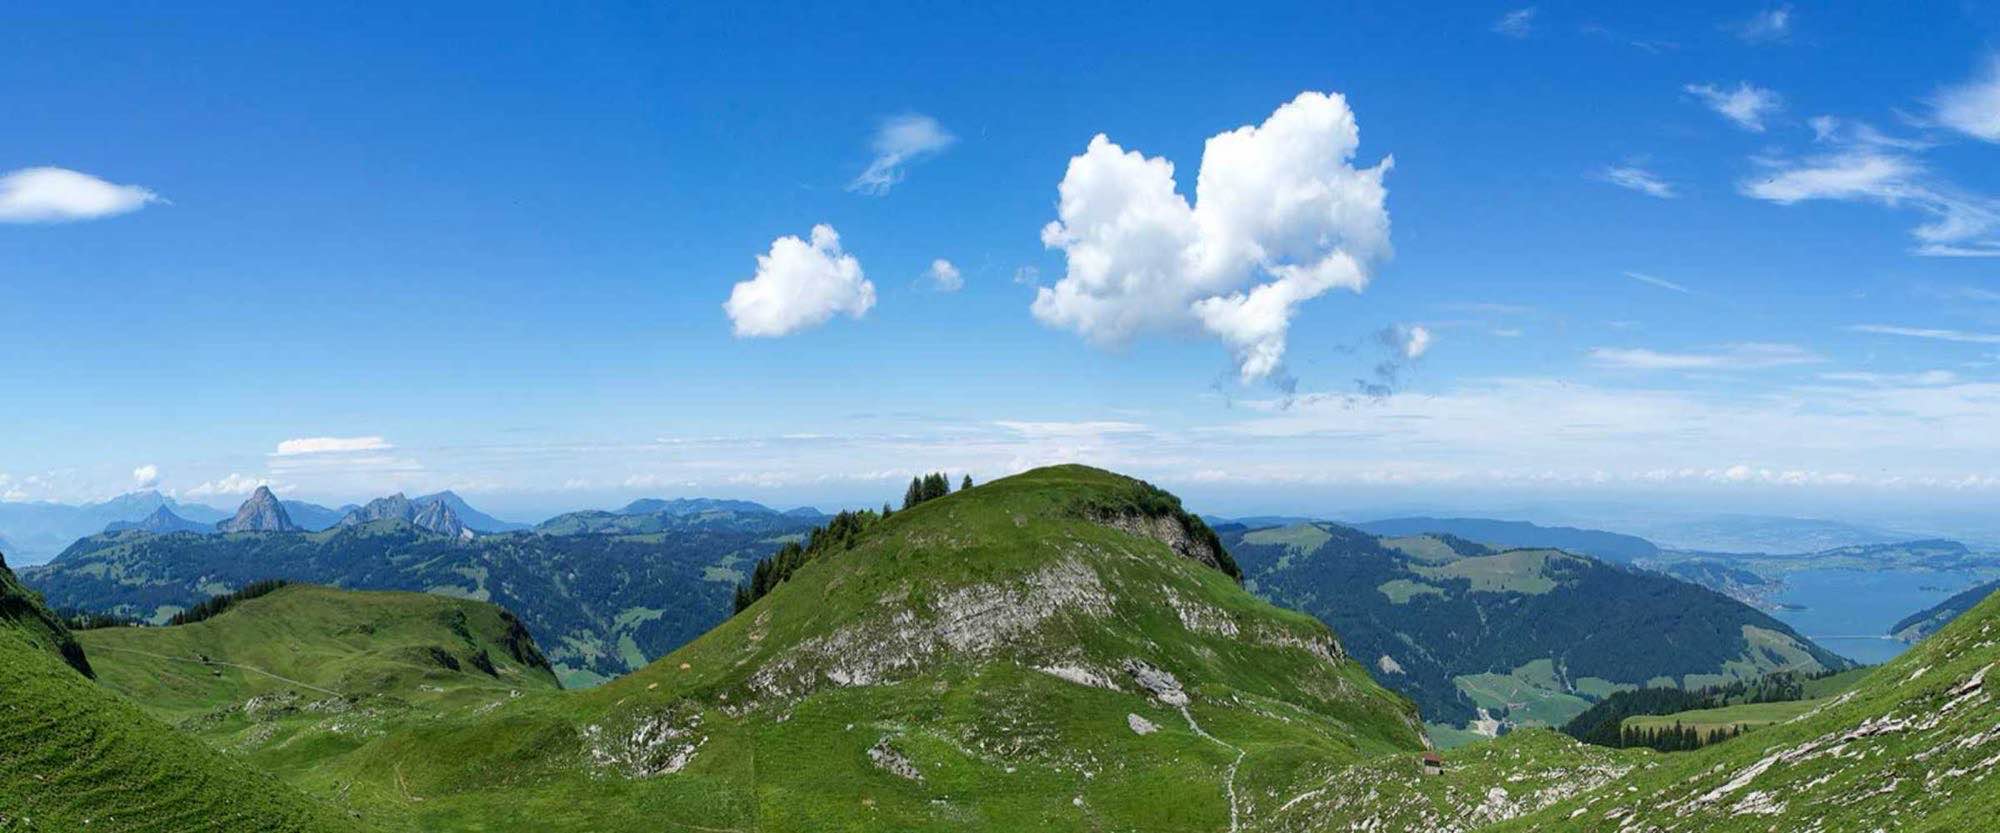
Sample report: the Tellskapelle on Lake Uri
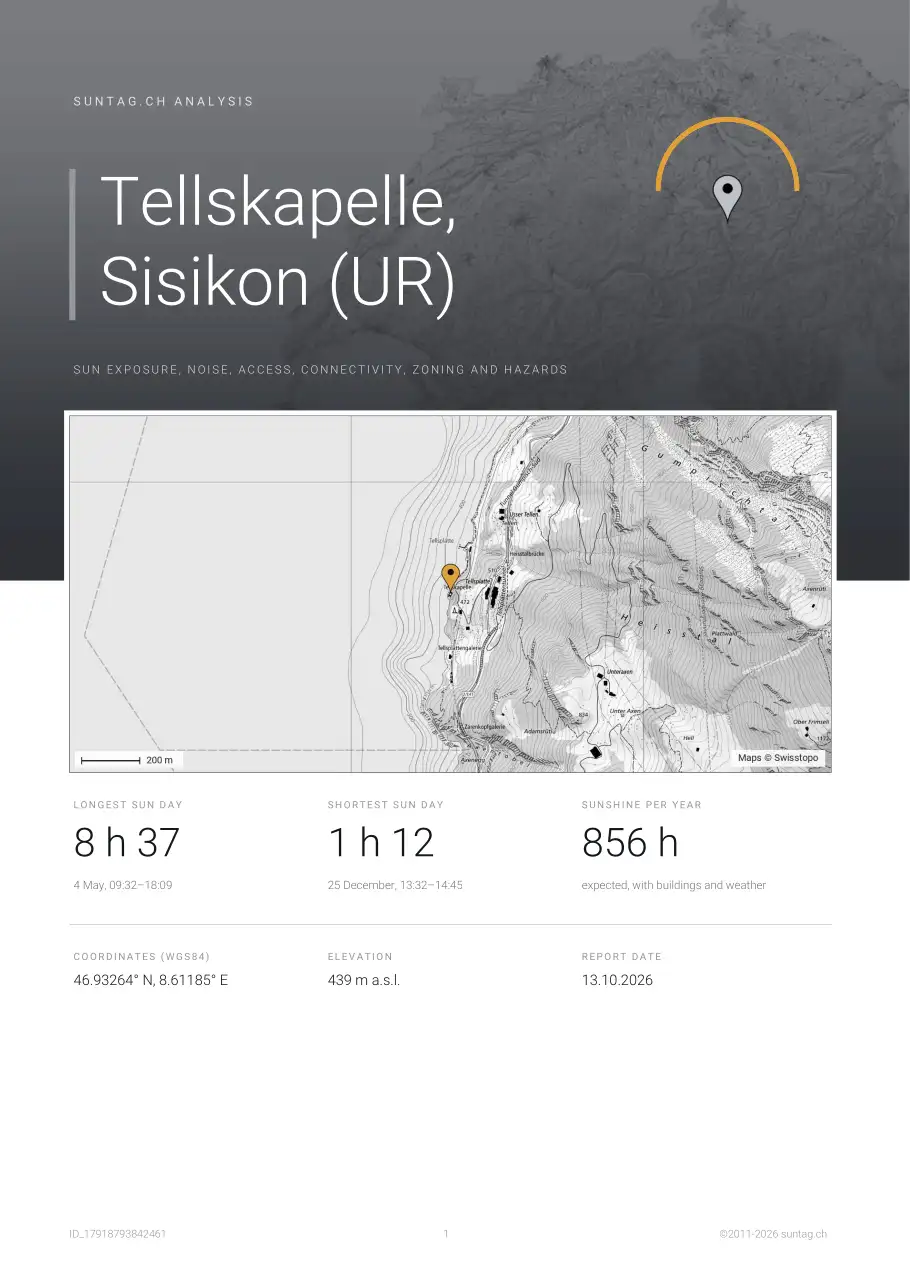
This is what a suntag.ch report looks like: all 38 pages, calculated for the Tellskapelle near Sisikon, a chapel at the foot of the cliffs of Lake Uri, where the mountains hide the sun early in winter. Your own report has the same structure, with the values of your address.
- 38Pagesstandard, portrait
- 53Charts and maps12 charts, 41 maps
- about 10 sReady inas PDF and by e-mail
- 2011Sincesuntag.ch
Download as PDF: Standard (portrait, with the suntag.ch logo) · Premium (landscape, no logo, to pass on)
What the report contains
First a one-page summary ("At a glance"), then six chapters. Each chapter opens with an introduction: what you will find, what to look out for and why it matters.
- Sunshine – Sun and shade, every season
- Noise and air – Road, rail and aircraft noise, and air quality
- Connectivity – Commute, fibre and 5G
- Neighbourhood – Shops, building zones, heritage, accidents, contaminated sites and major-accident areas
- Radiation sources – Antennas, power lines and nuclear plants
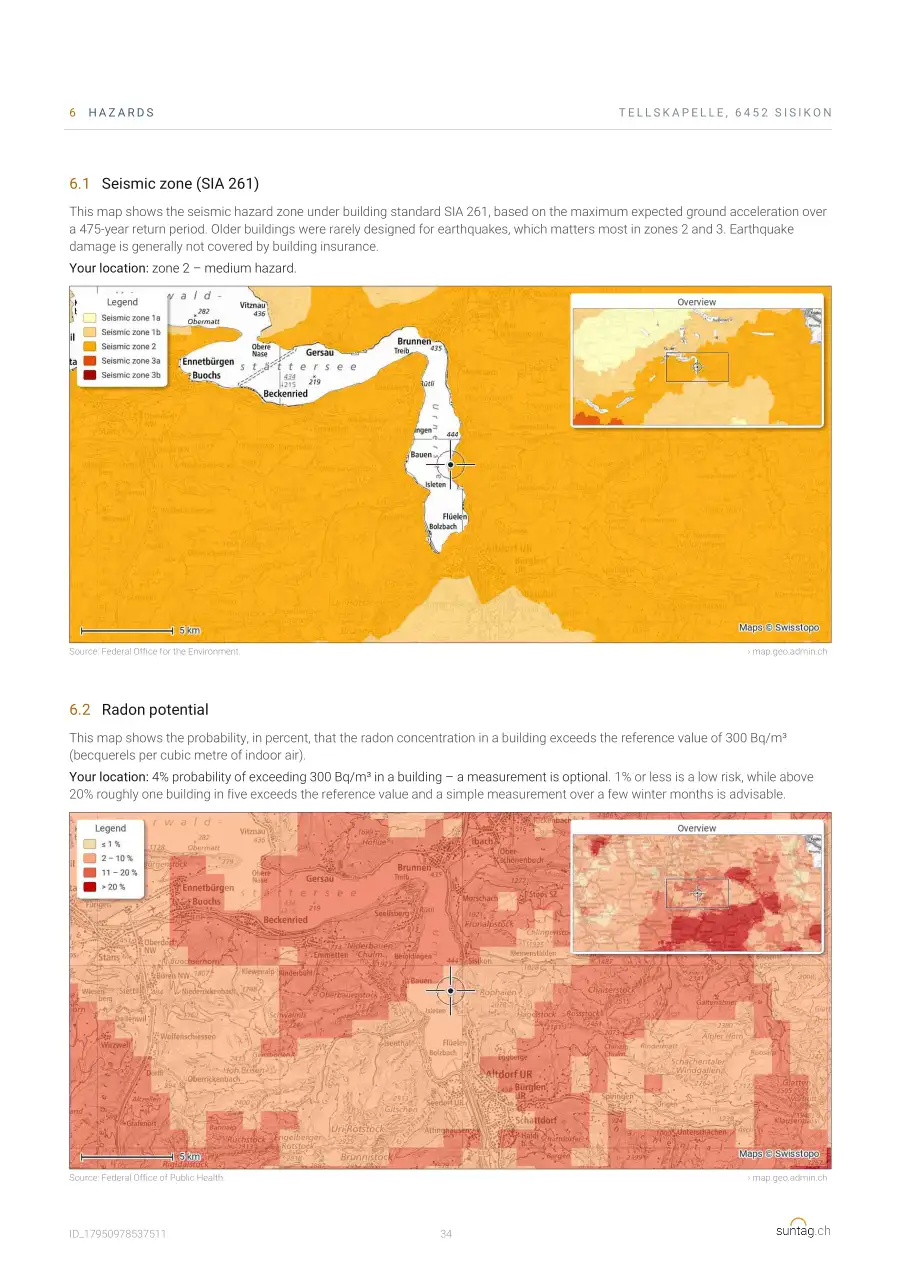
- Hazards – Earthquakes, radon, avalanches, floods, rockfall and hail
All pages
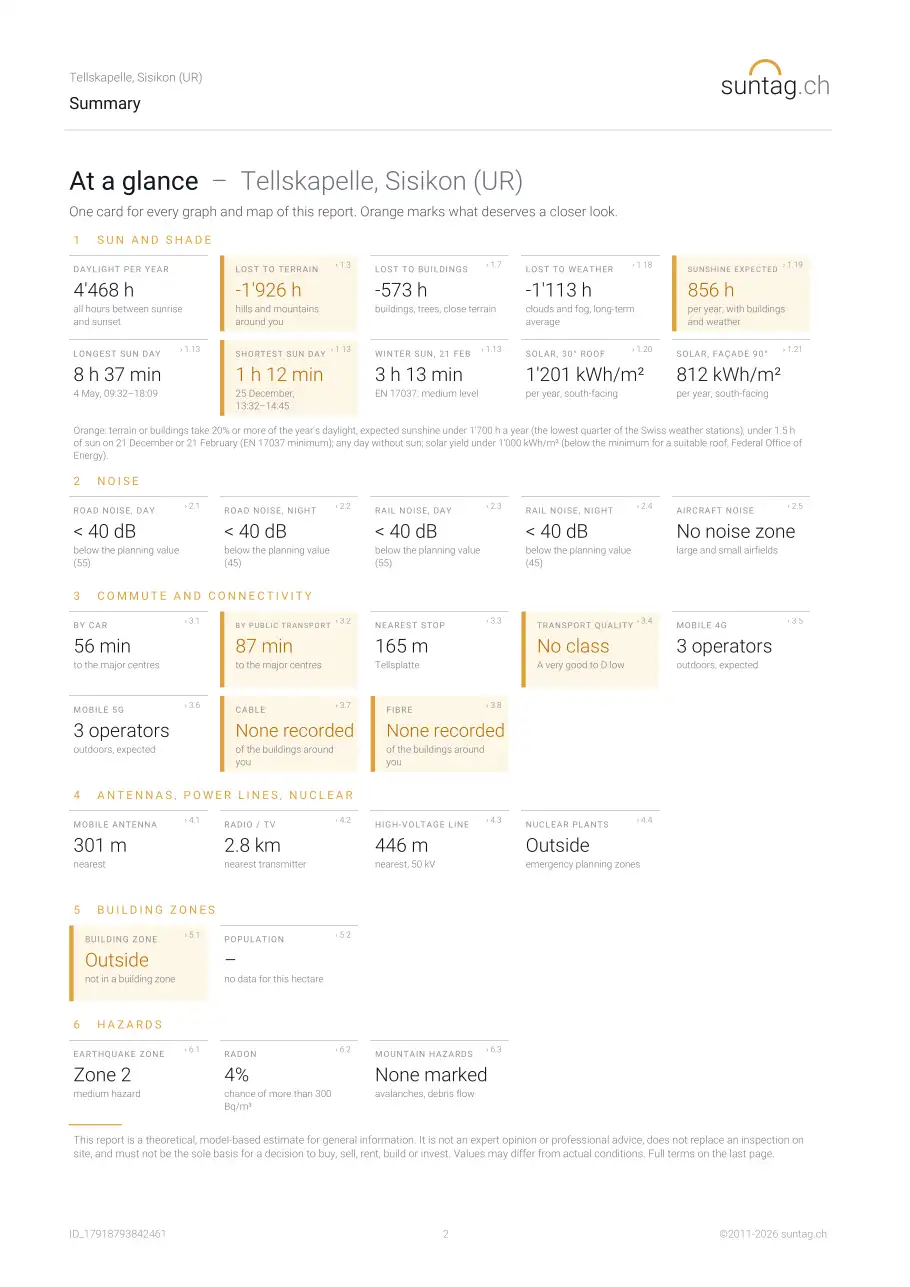
Cover and "At a glance" summary
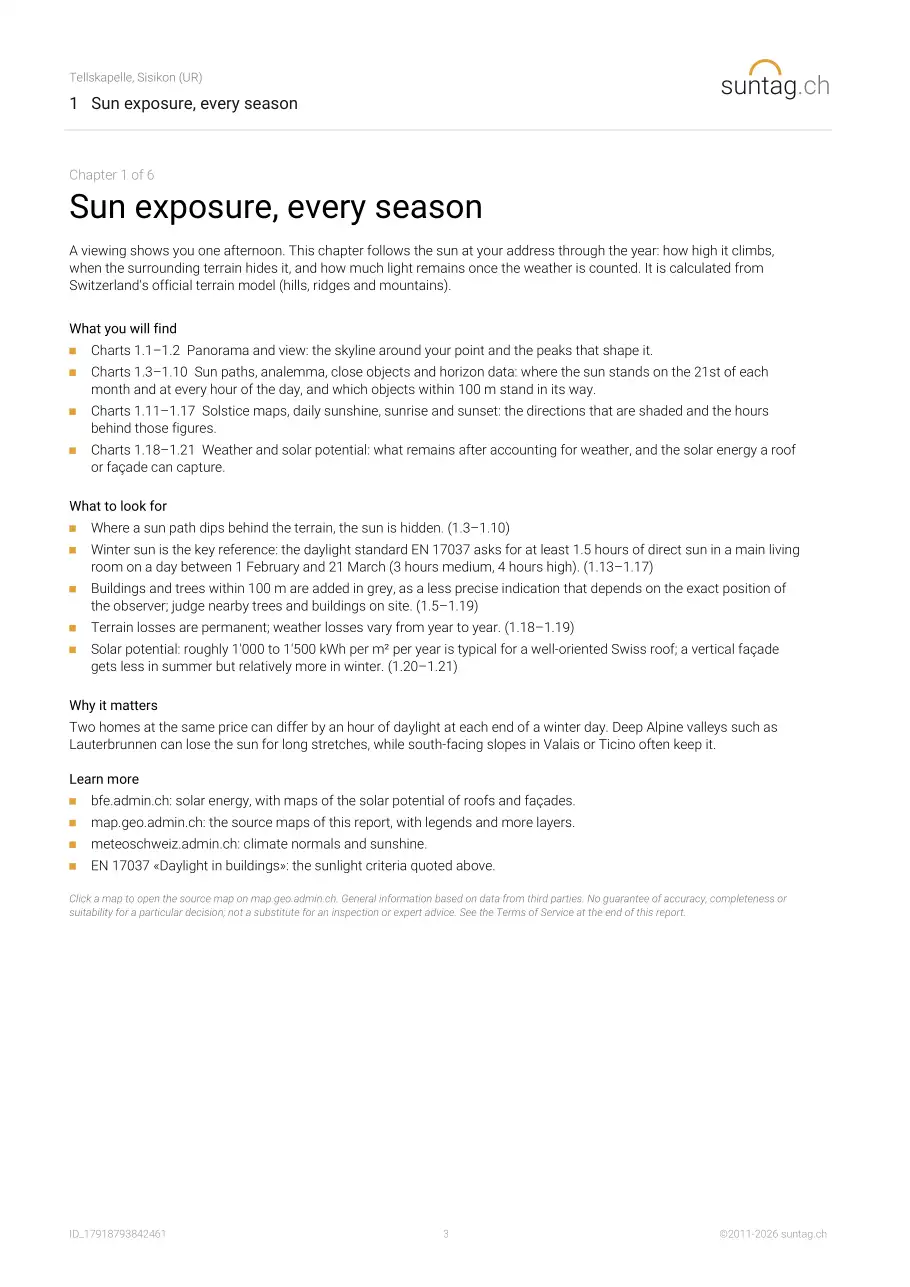
1 Sunshine
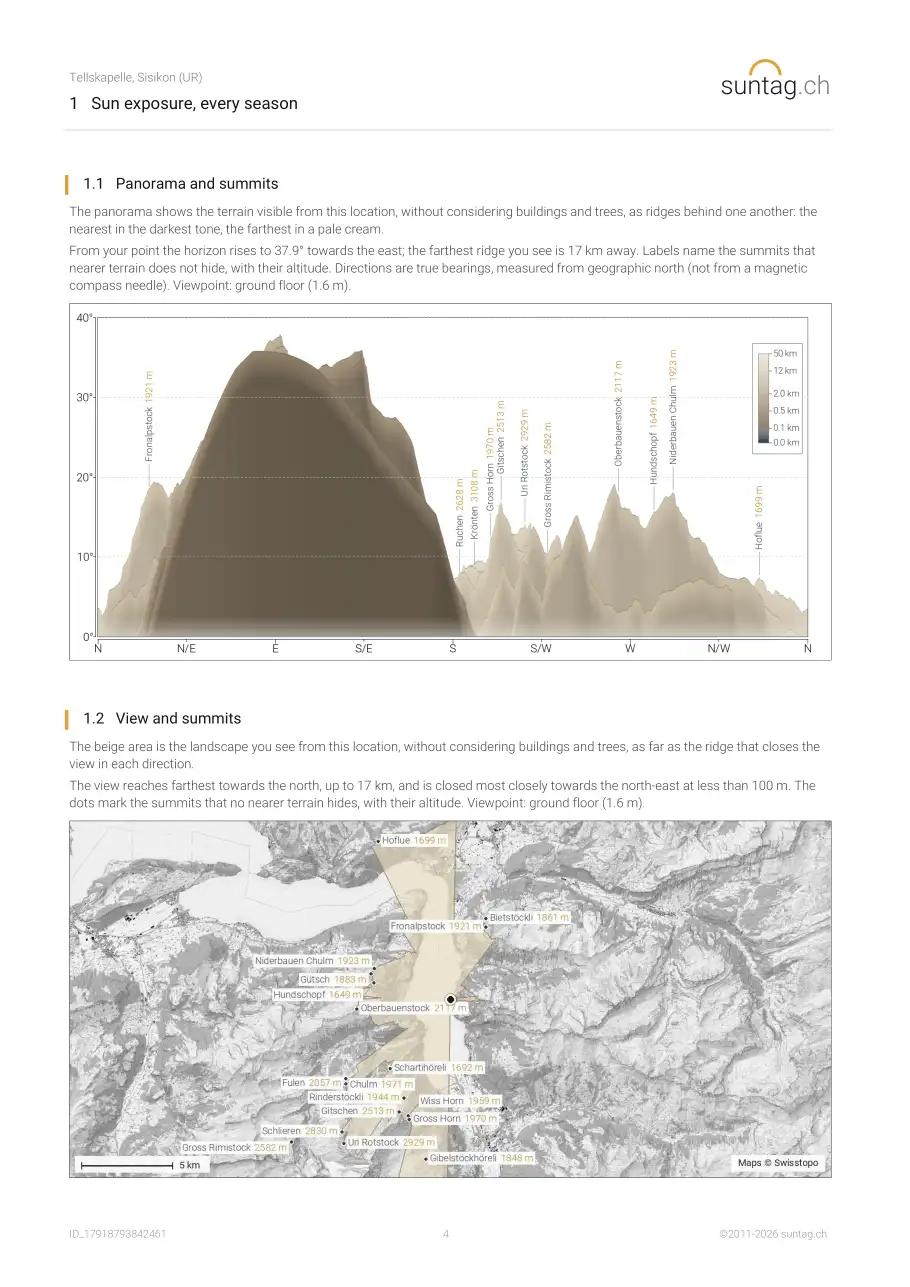
- 1.1 Panorama and summits
- 1.2 View and summits
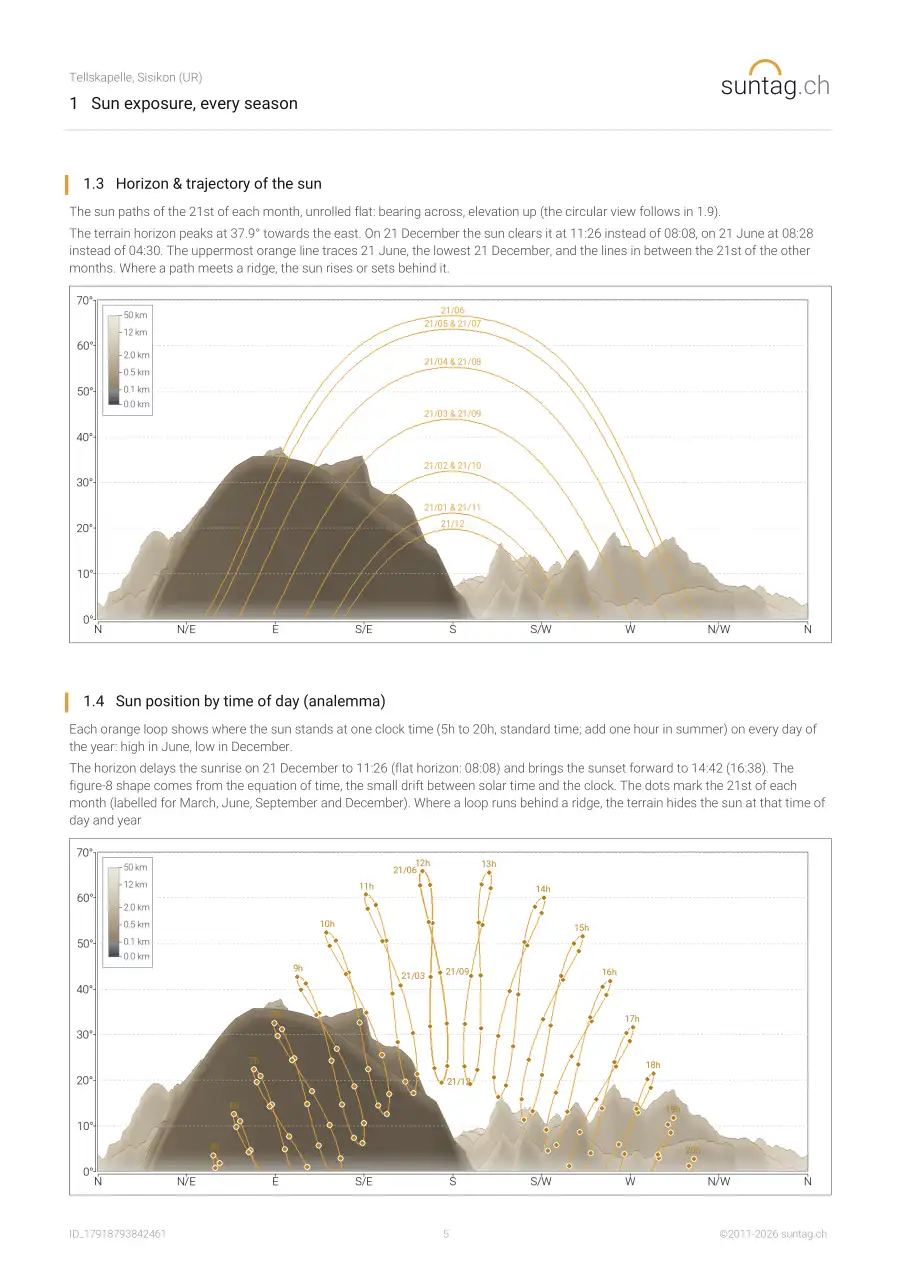
- 1.3 Horizon & trajectory of the sun
- 1.4 Sun position by time of day (analemma)
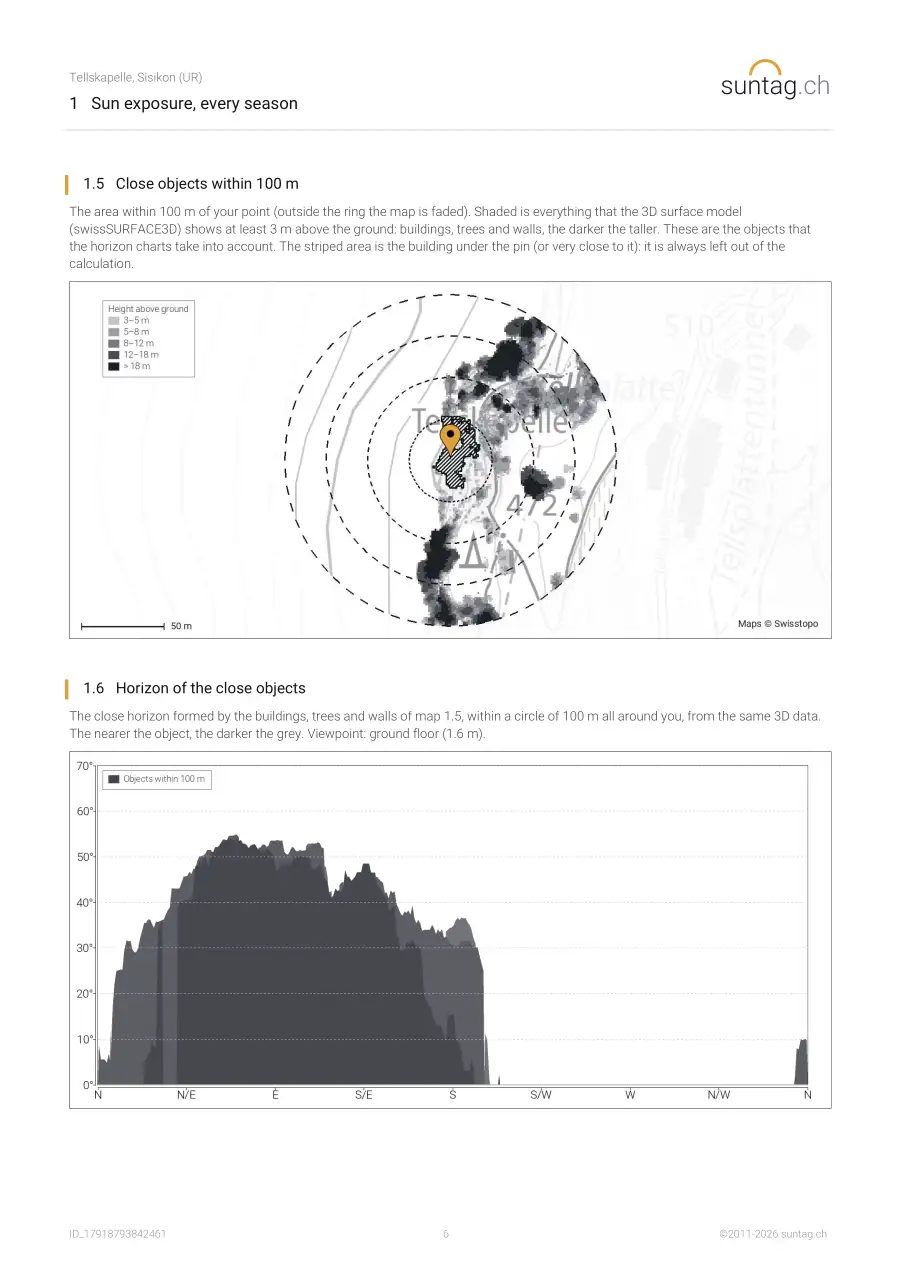
- 1.5 Close objects within 100 m
- 1.6 Horizon of the close objects
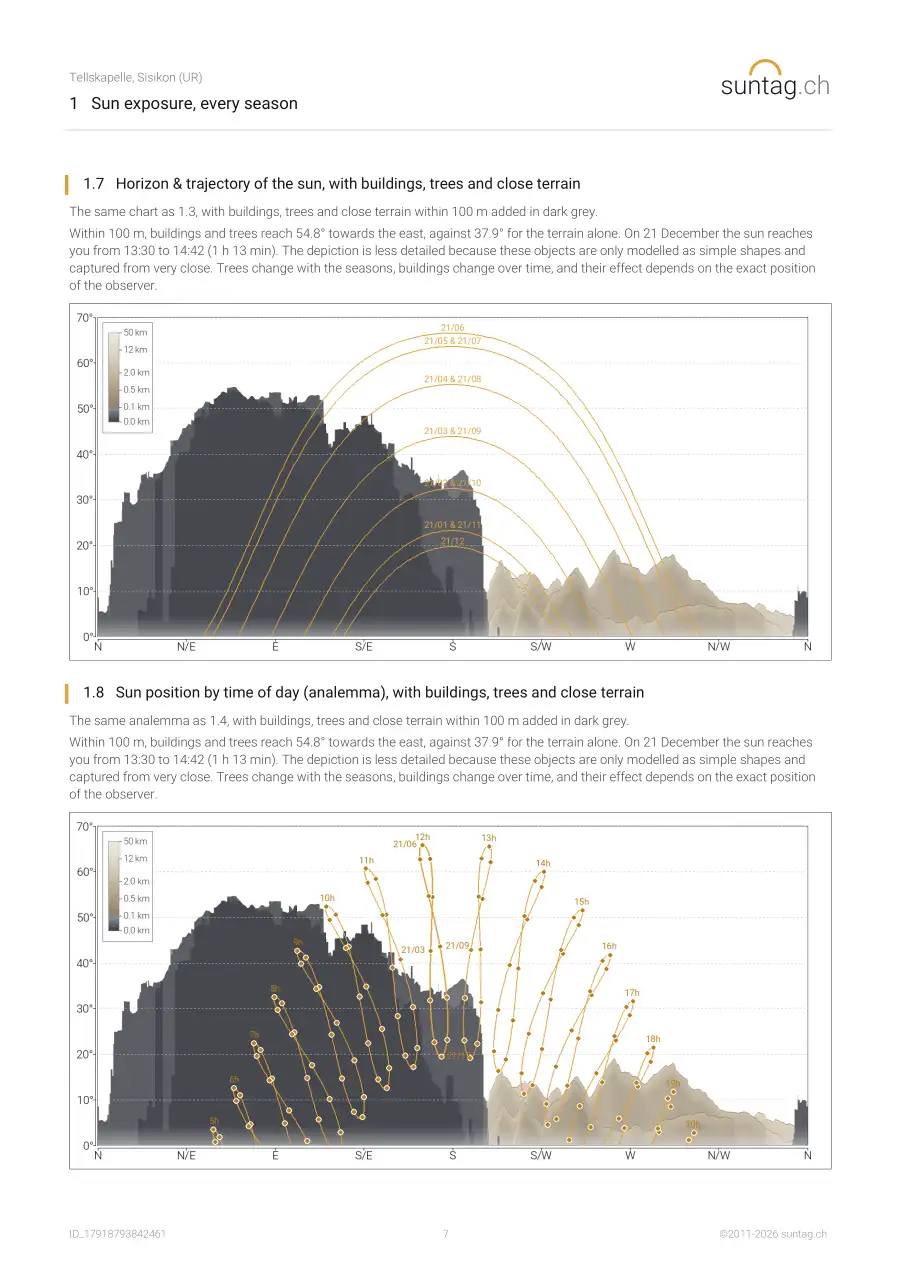
- 1.7 Horizon & trajectory of the sun, with buildings, trees and close terrain
- 1.8 Sun position by time of day (analemma), with buildings, trees and close terrain
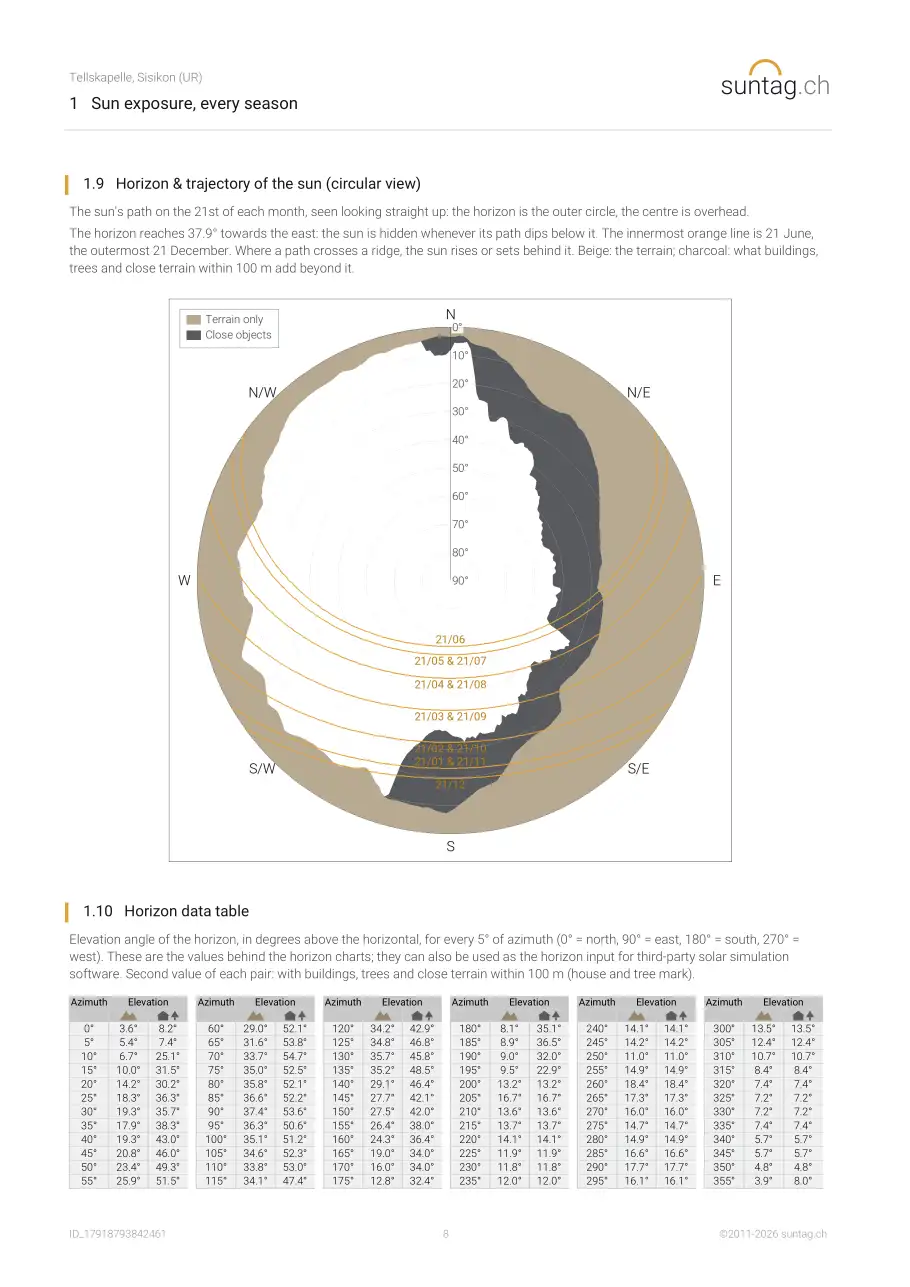
- 1.9 Horizon & trajectory of the sun (circular view)
- 1.10 Horizon data table
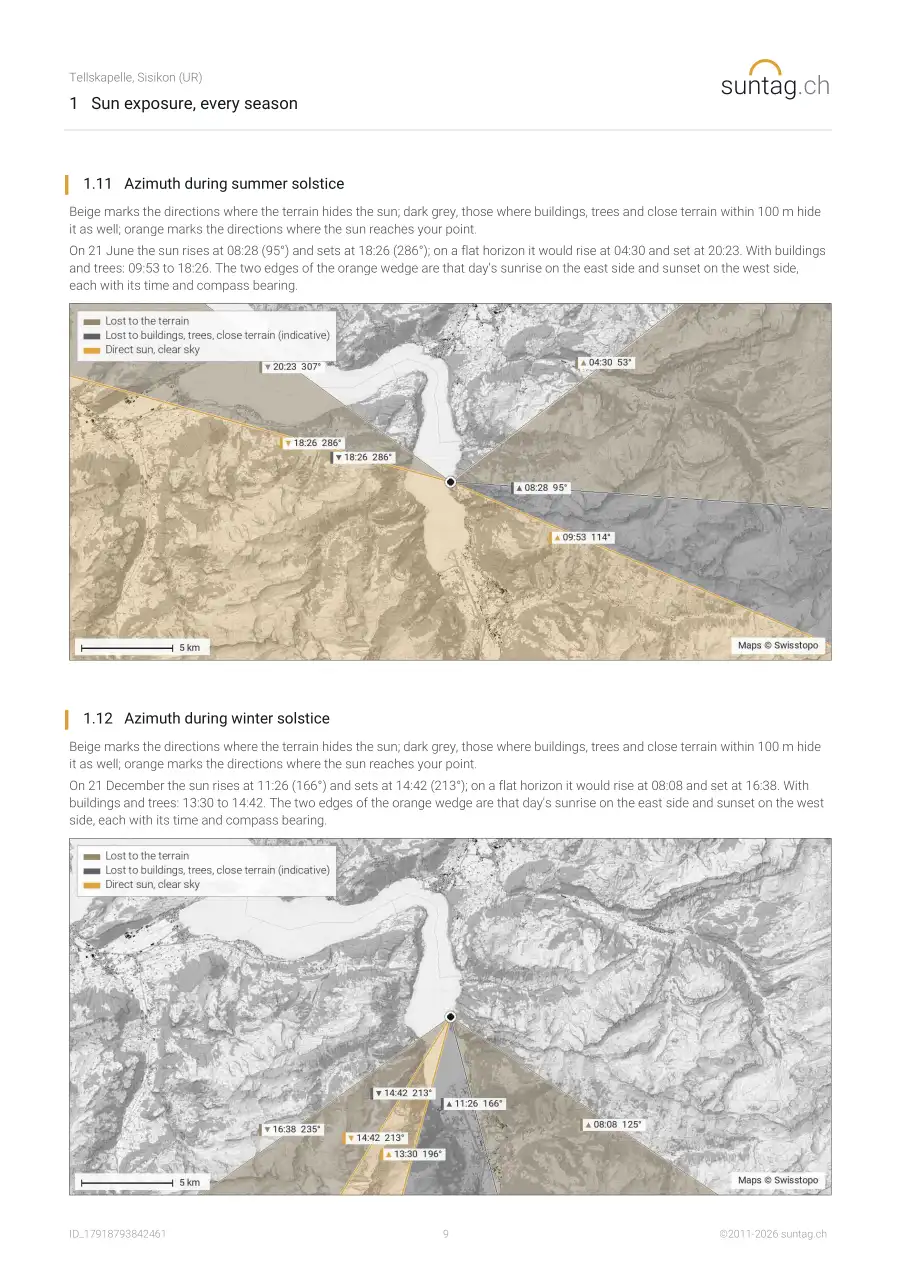
- 1.11 Azimuth during summer solstice
- 1.12 Azimuth during winter solstice
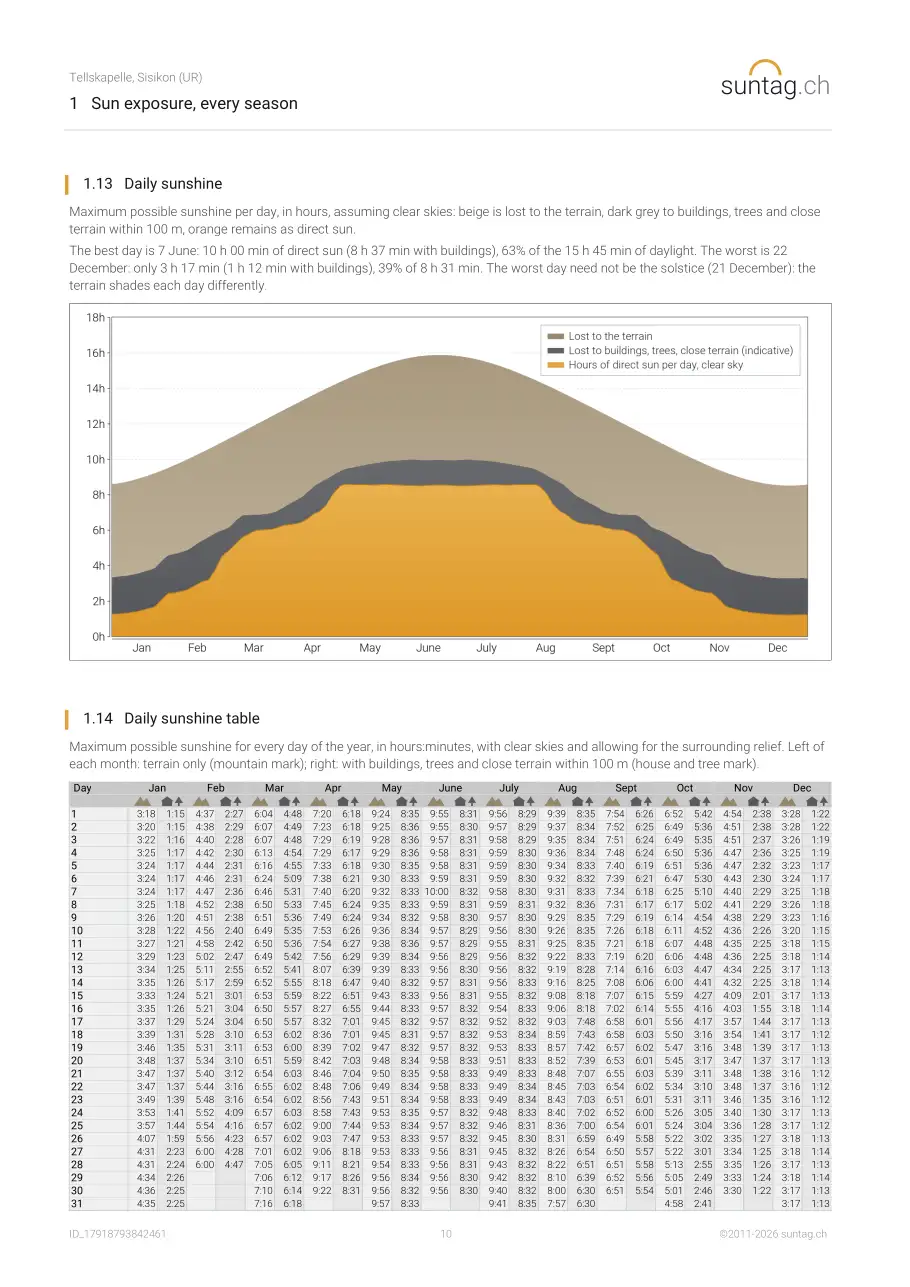
- 1.13 Daily sunshine
- 1.14 Daily sunshine table
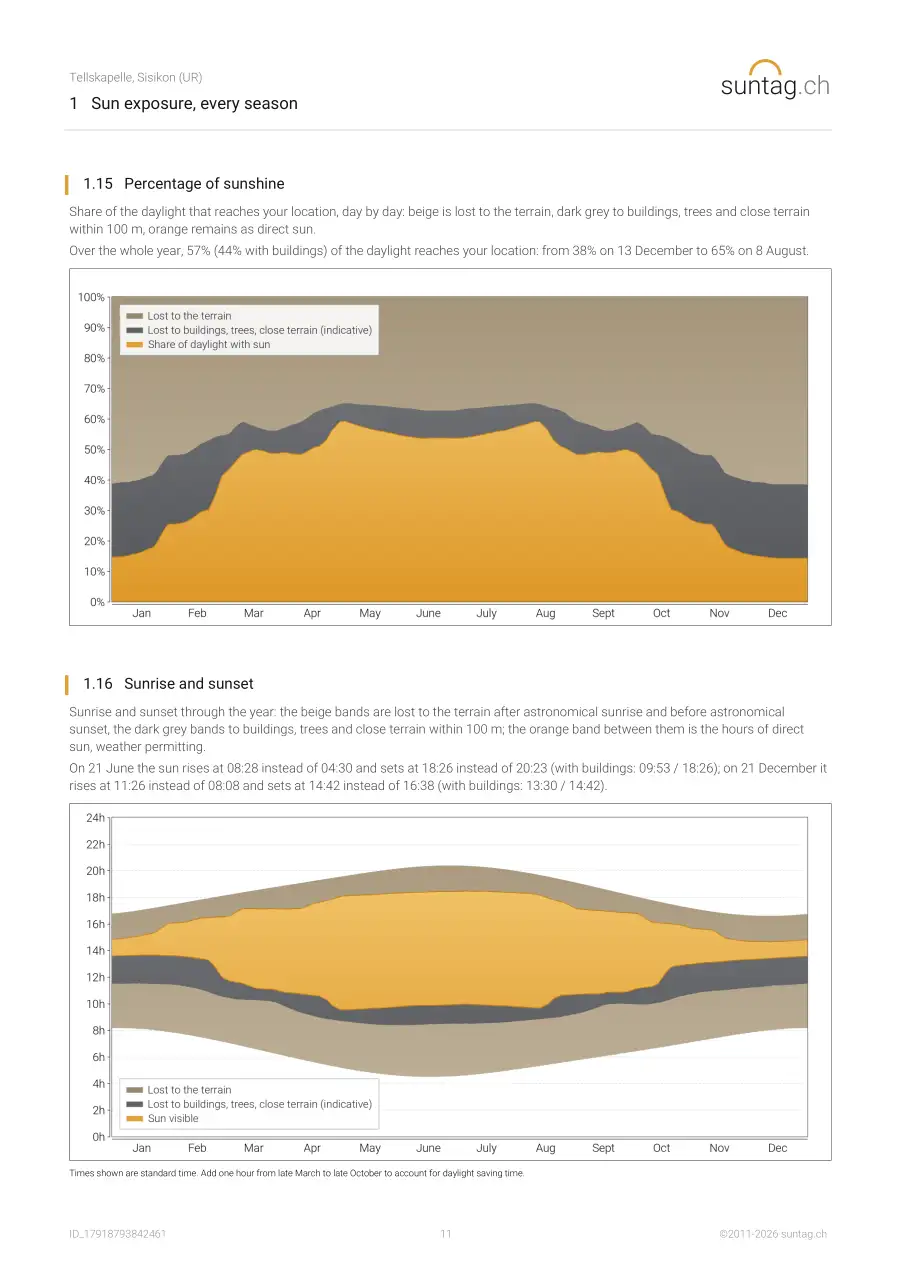
- 1.15 Percentage of sunshine
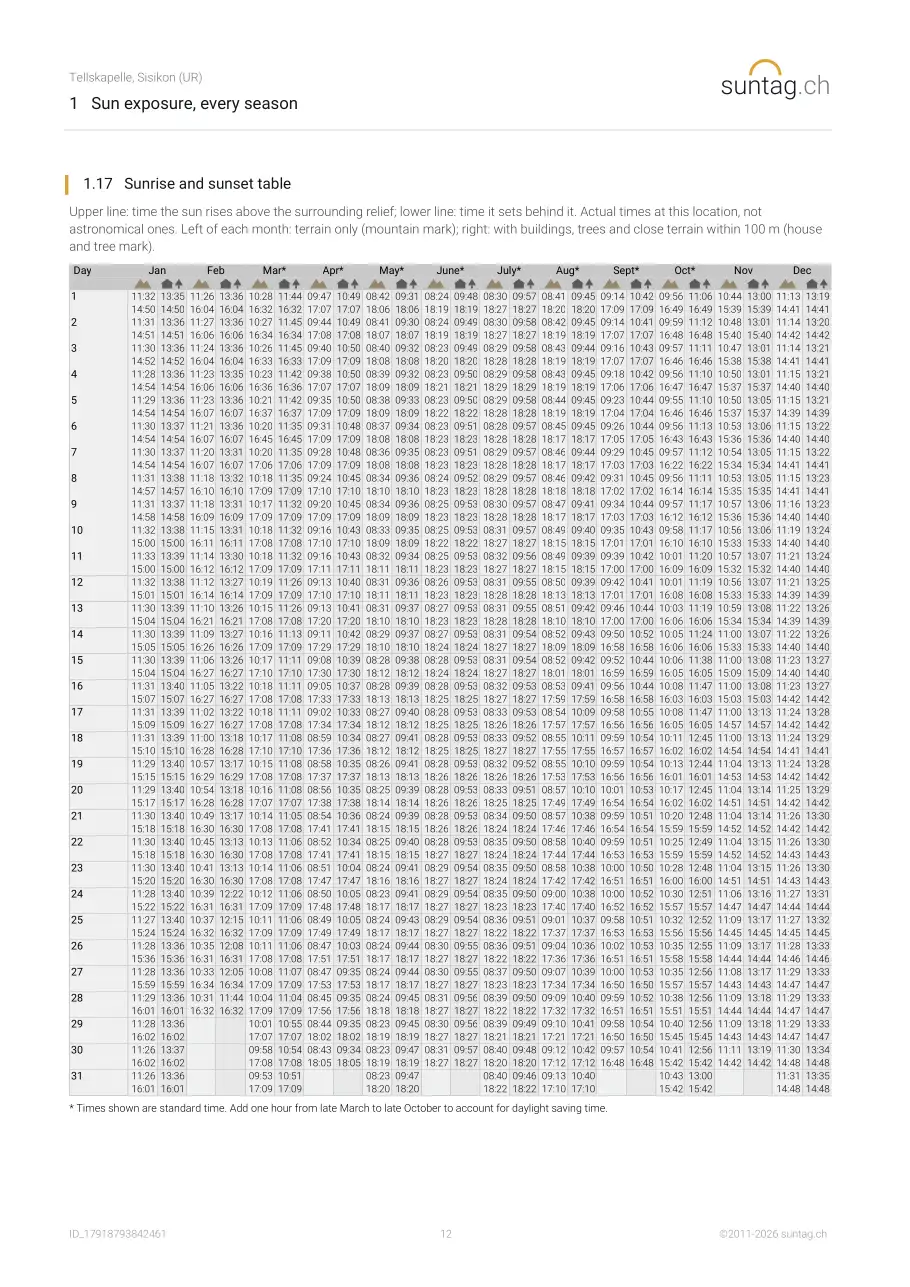
- 1.16 Sunrise and sunset
- 1.17 Sunrise and sunset table
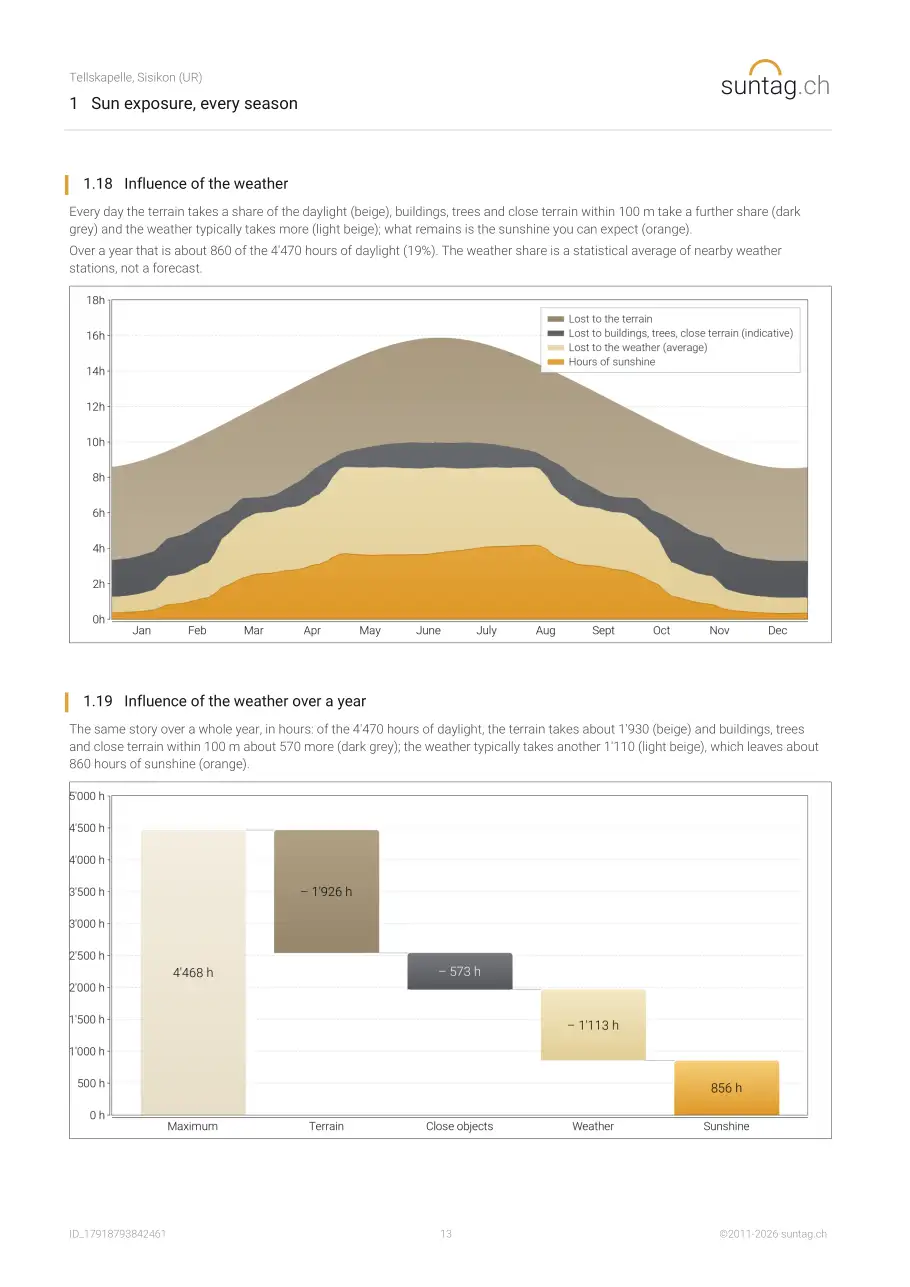
- 1.18 Influence of the weather
- 1.19 Influence of the weather over a year
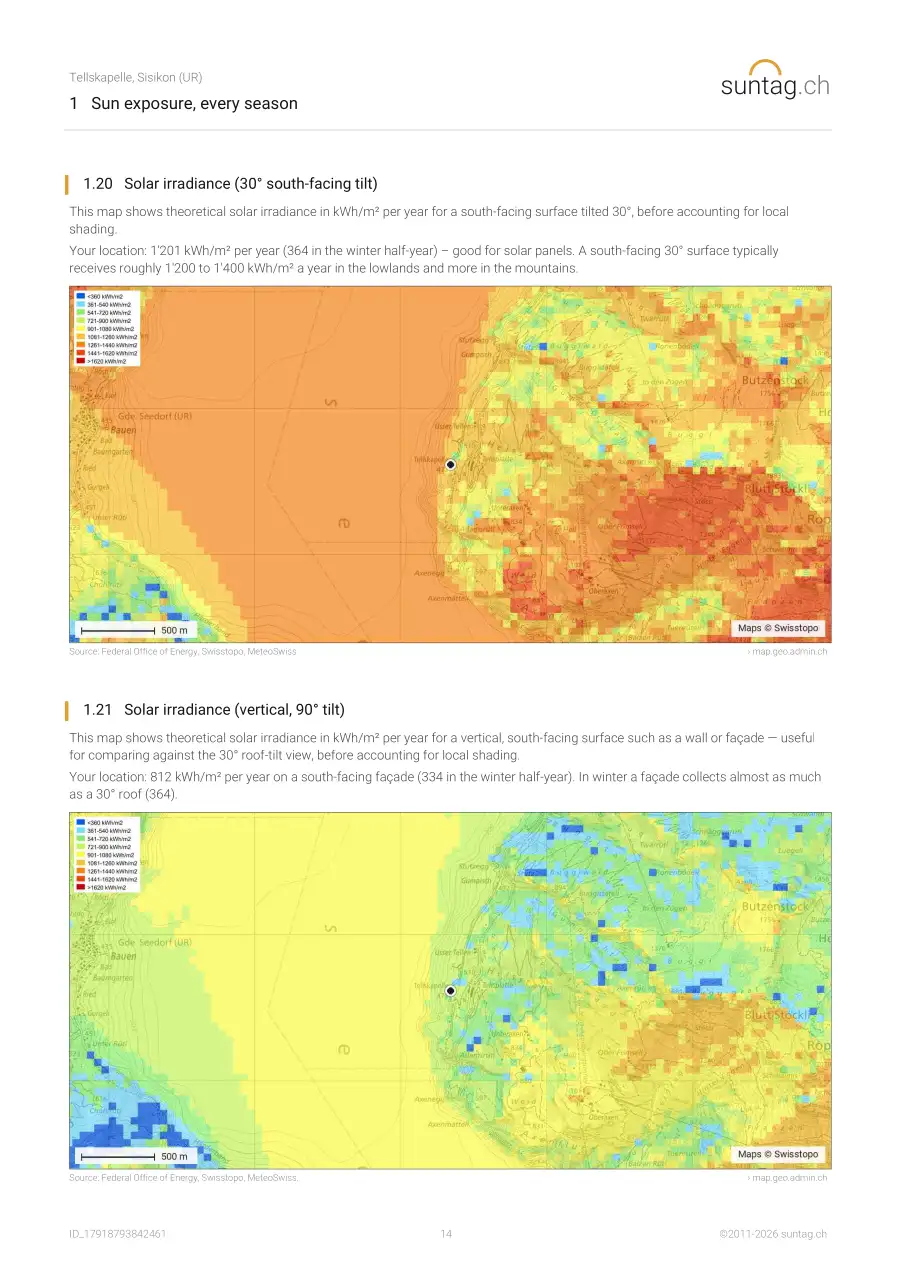
- 1.20 Your roof and façades: suitability for solar power
2 Noise and air
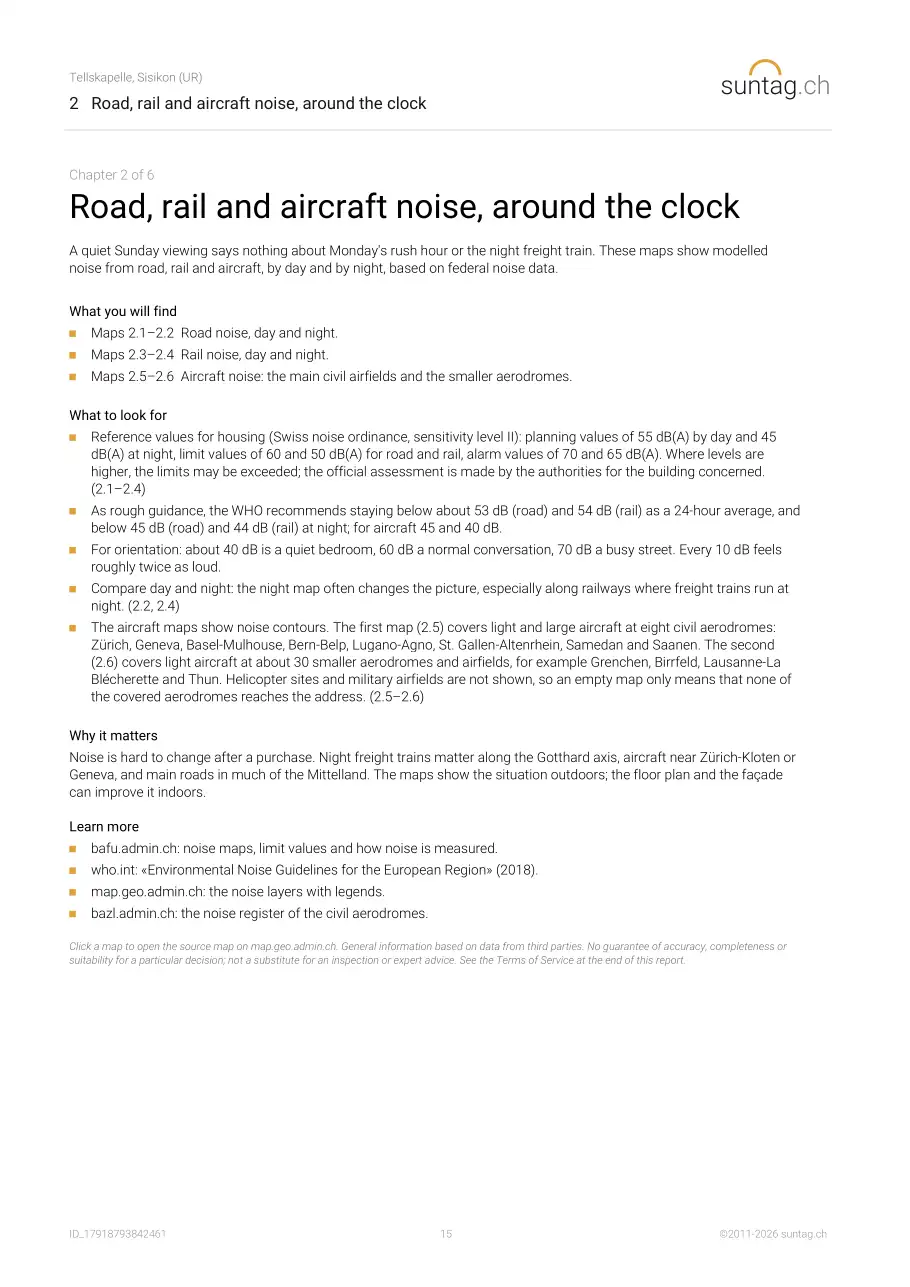
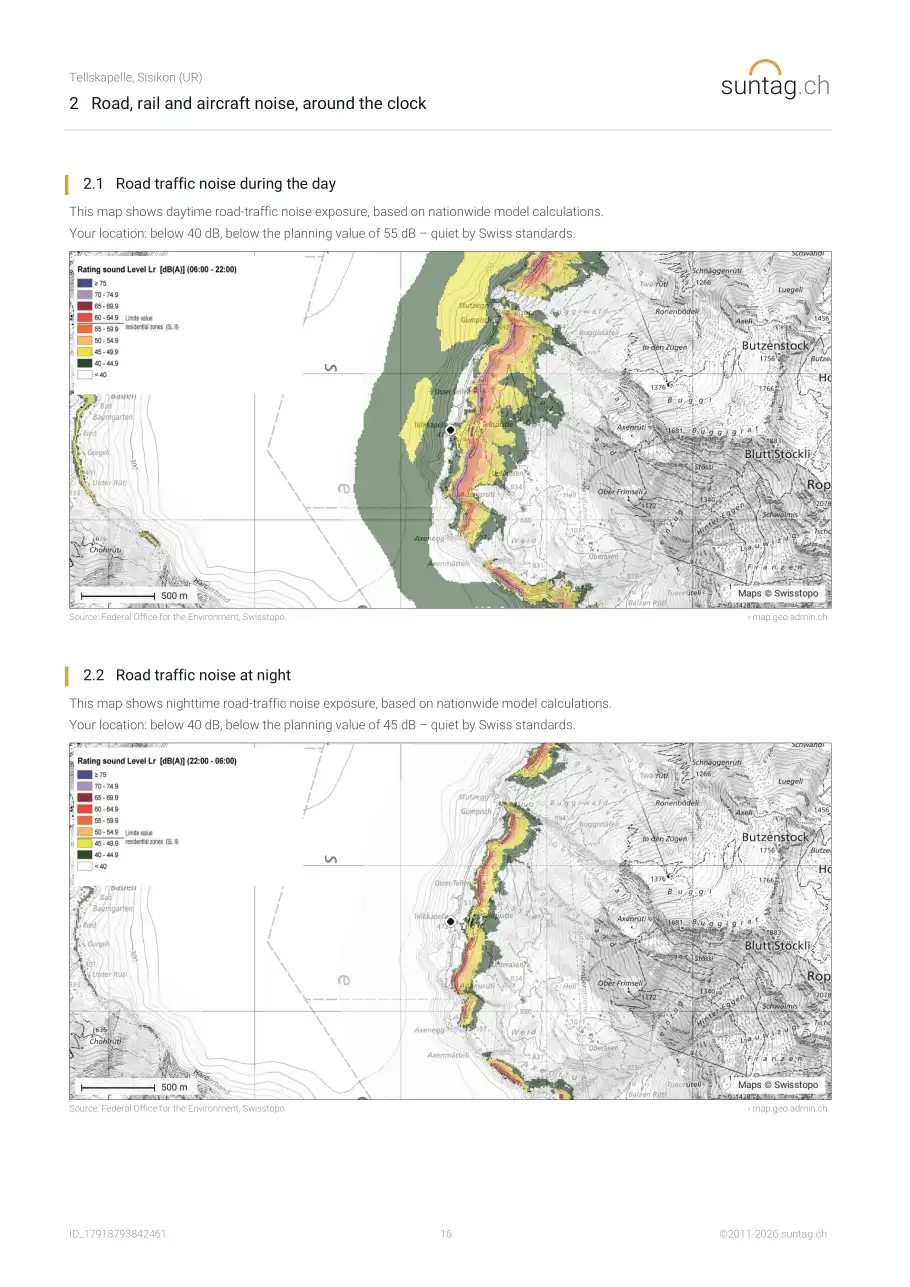
- 2.1 Road traffic noise during the day
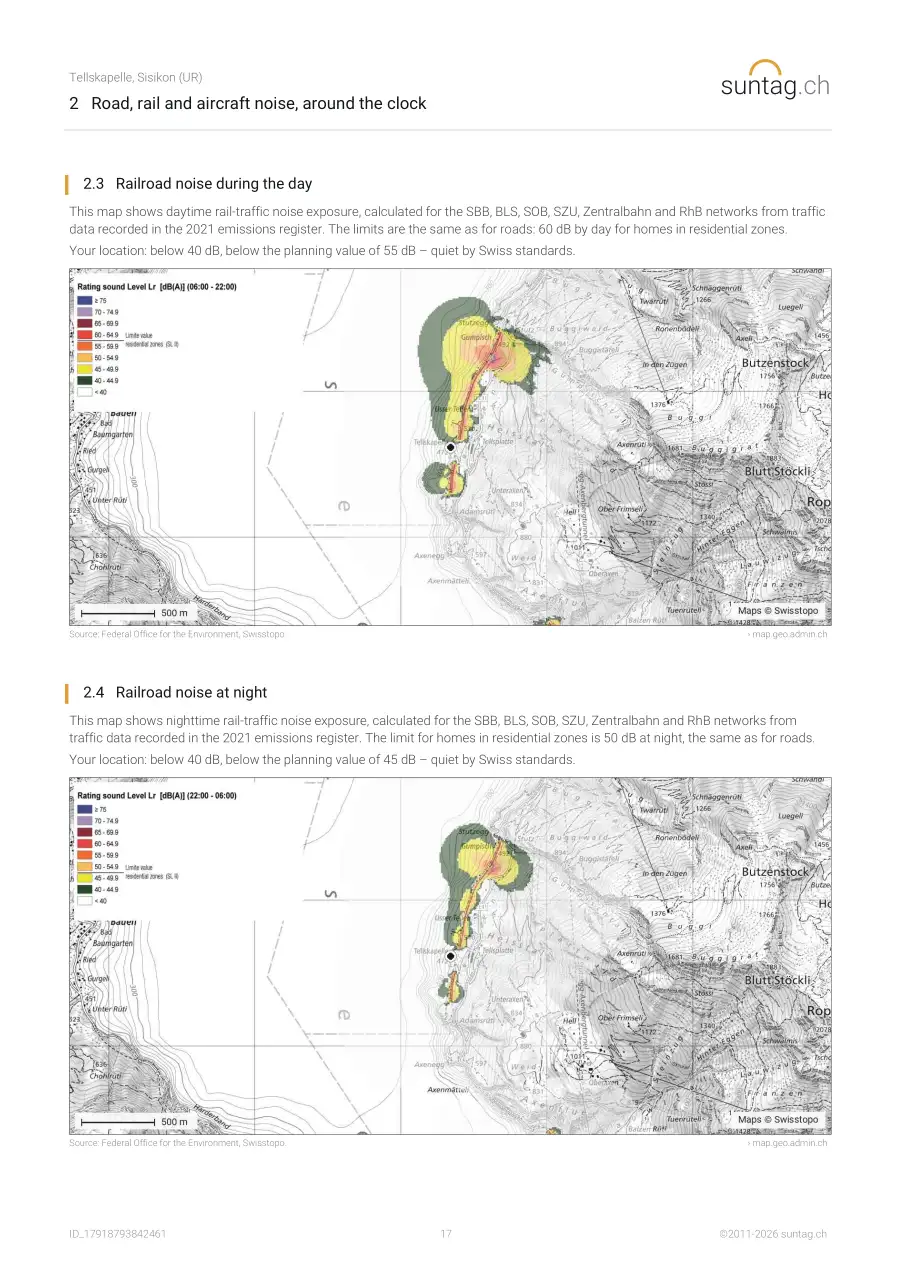
- 2.2 Road traffic noise at night
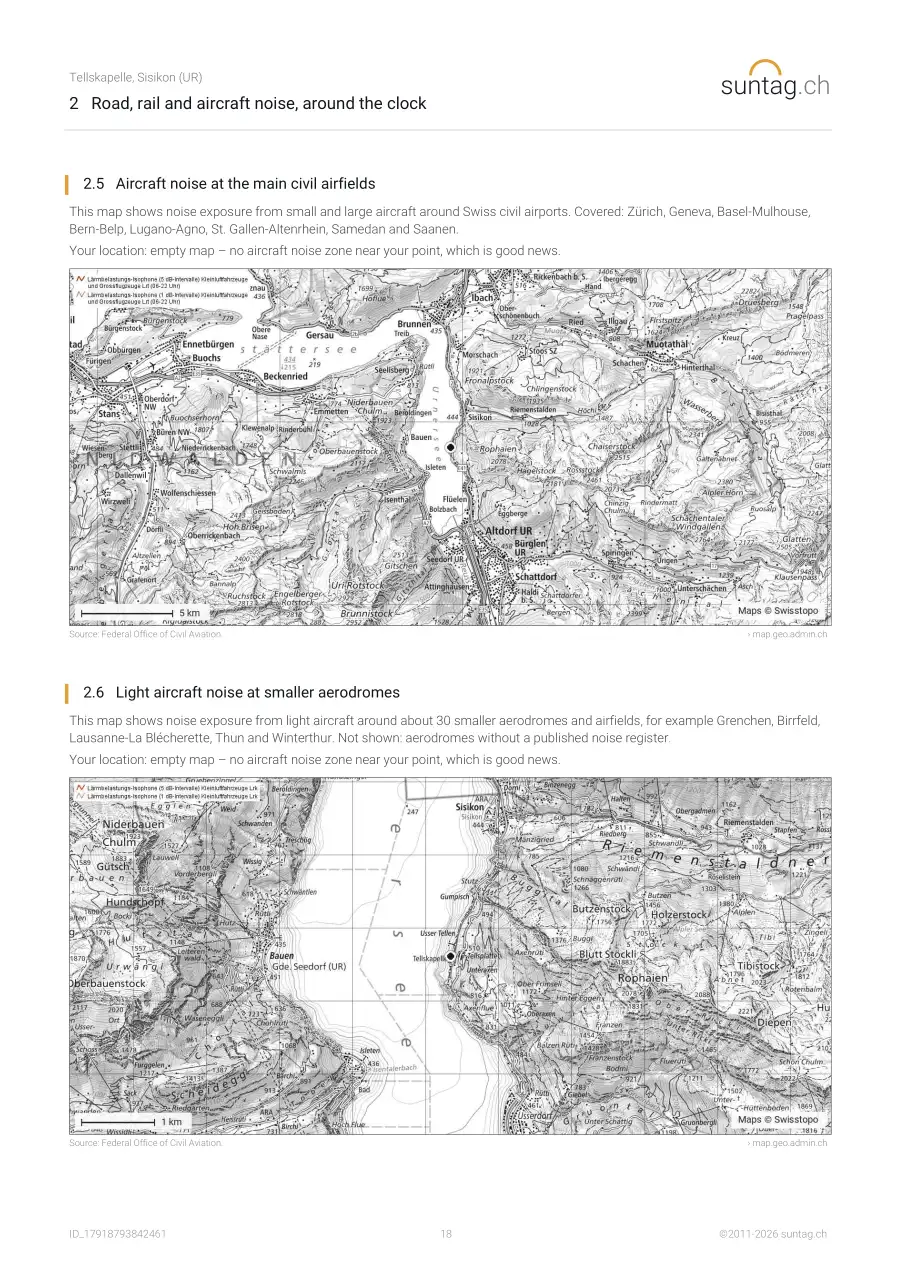
- 2.3 Railroad noise during the day
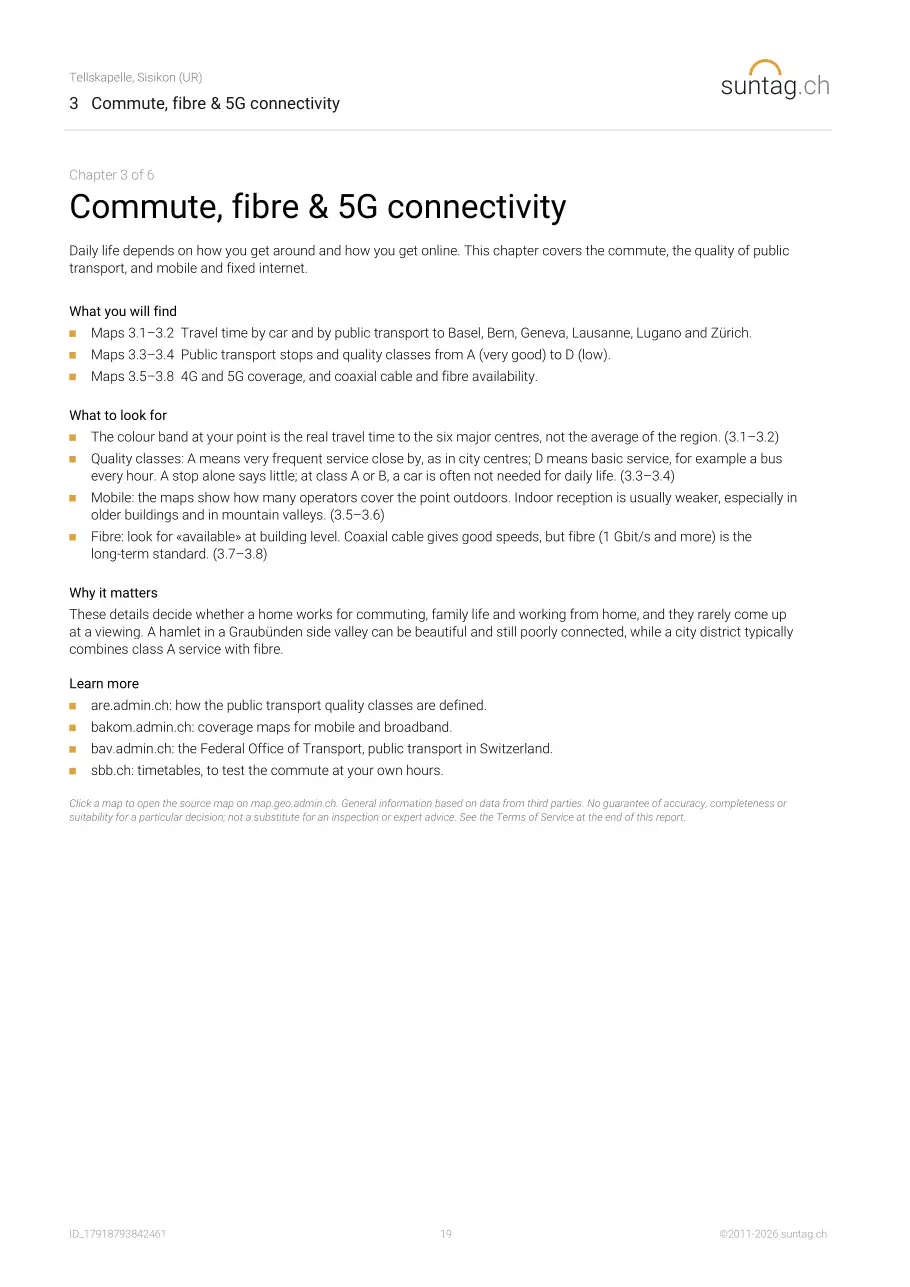
- 2.4 Railroad noise at night
- 2.5 Aircraft noise at the main civil airfields
- 2.6 Light aircraft noise at smaller aerodromes
- 2.7 Air quality: nitrogen dioxide (NO2)
- 2.8 Air quality: fine particles (PM2.5) in the region
3 Connectivity
- 3.1 Accessibility by car
- 3.2 Accessibility by public transport
- 3.3 Public transport stops
- 3.4 Public transport quality classes
- 3.5 4G Availability
- 3.6 5G Availability
- 3.7 Coaxial Cable Availability
- 3.8 Optical Fibre Availability
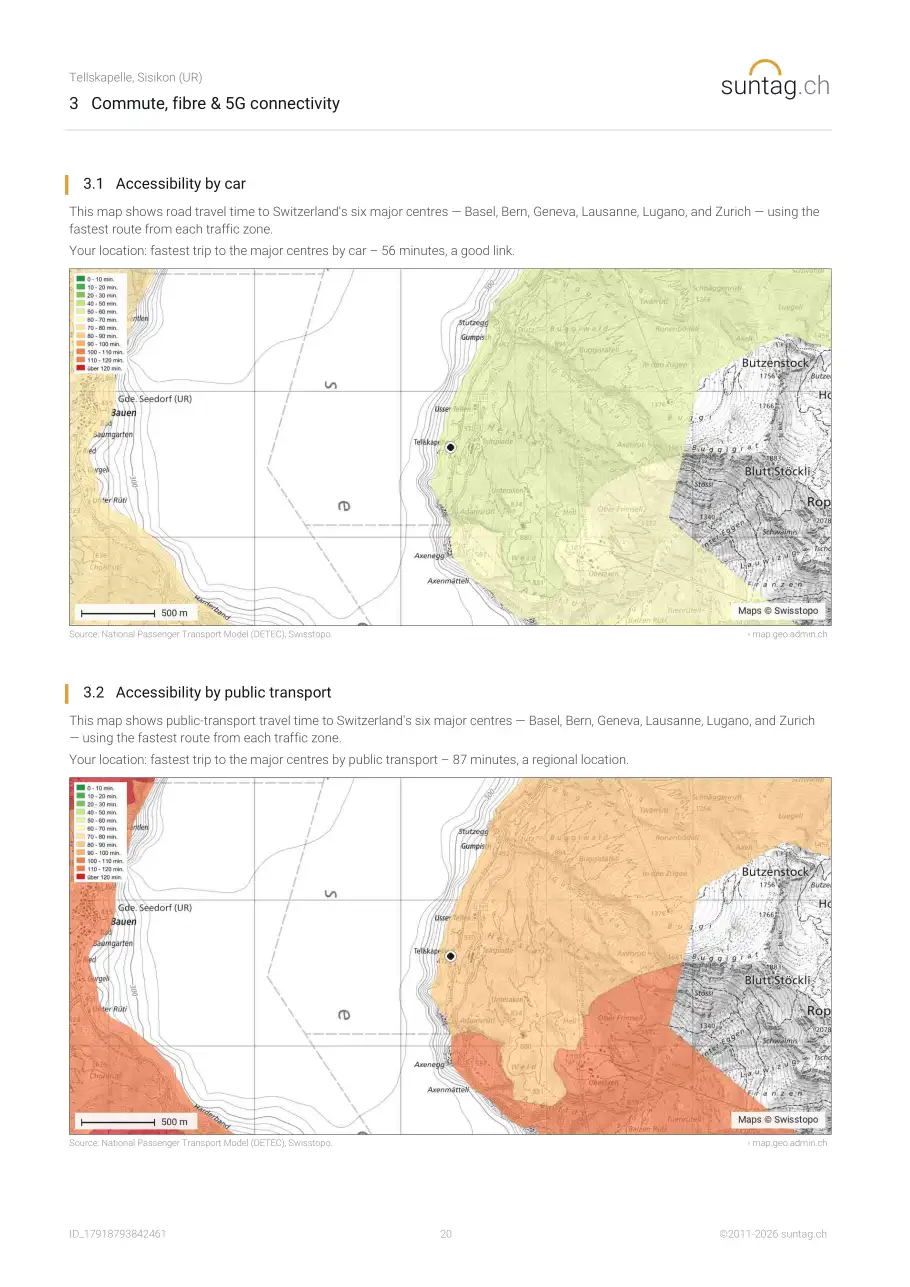
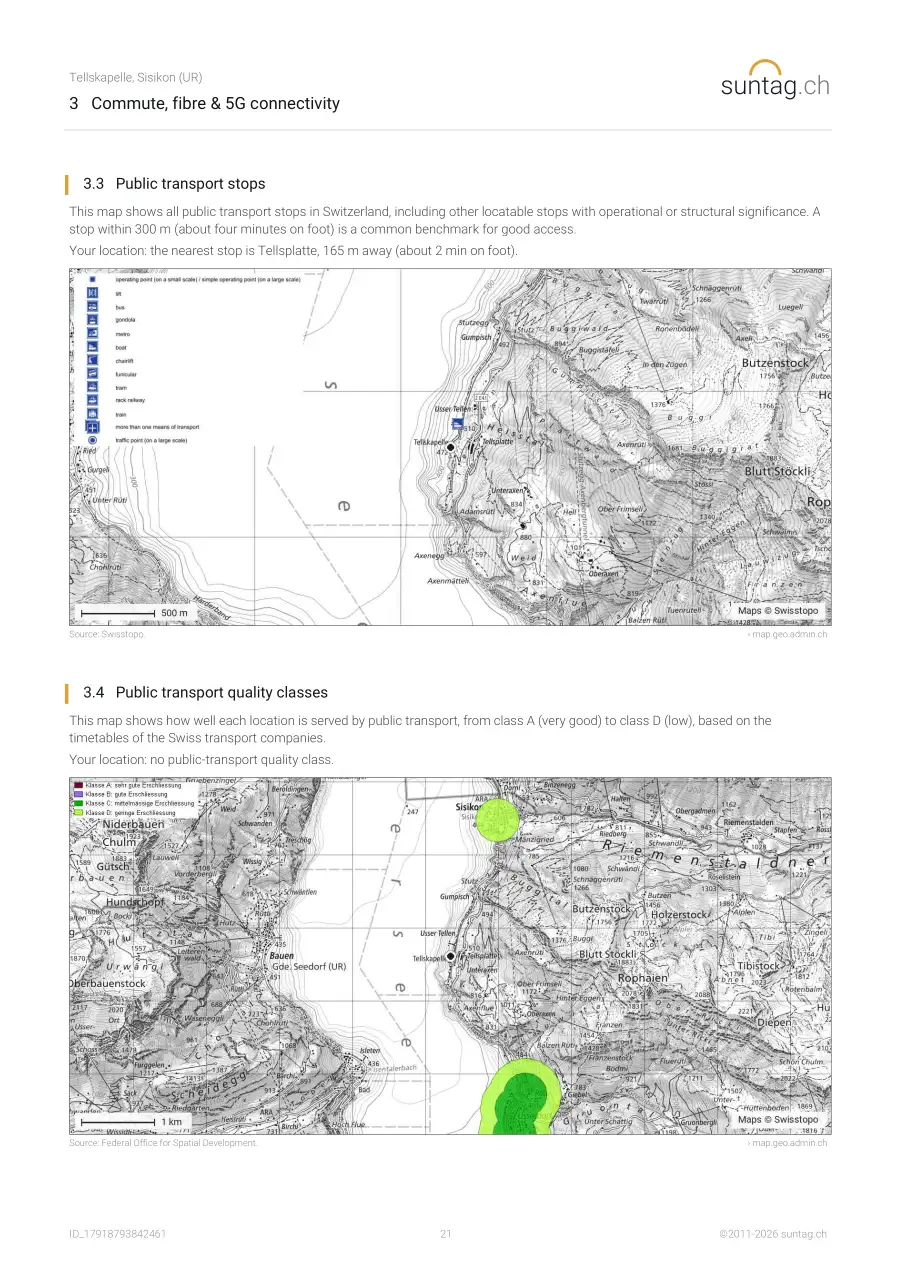
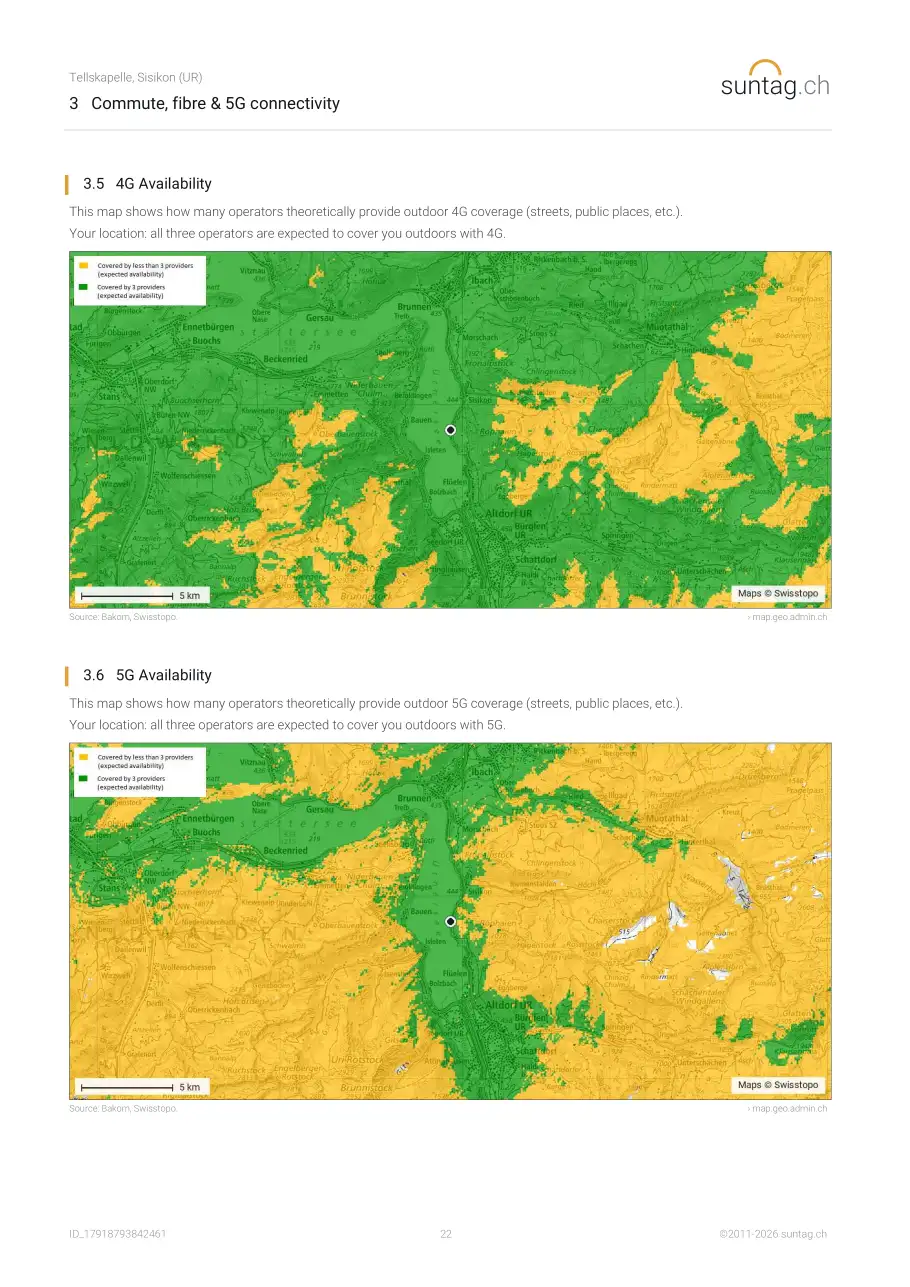
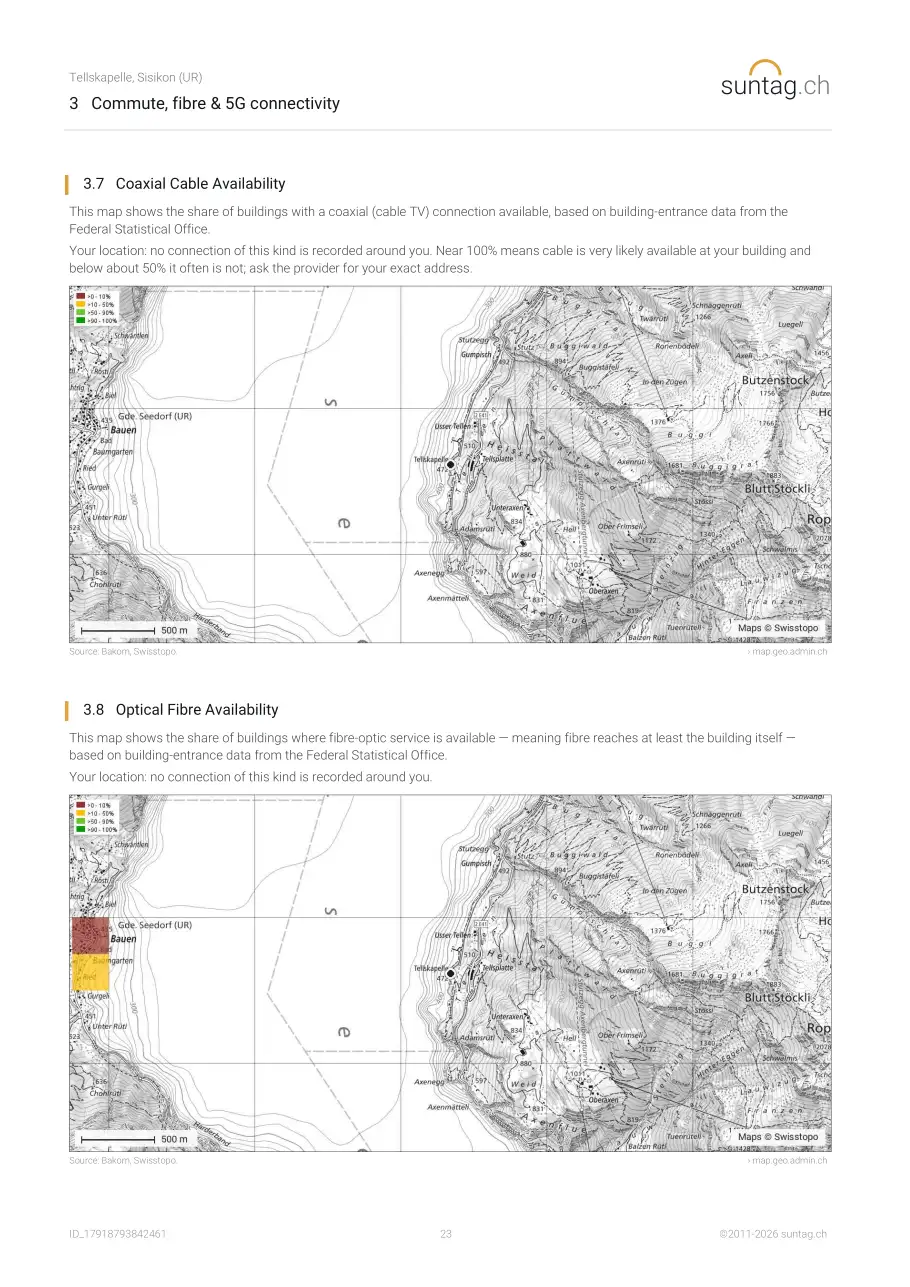
4 Neighbourhood
- 4.1 Shops, schools and health care nearby
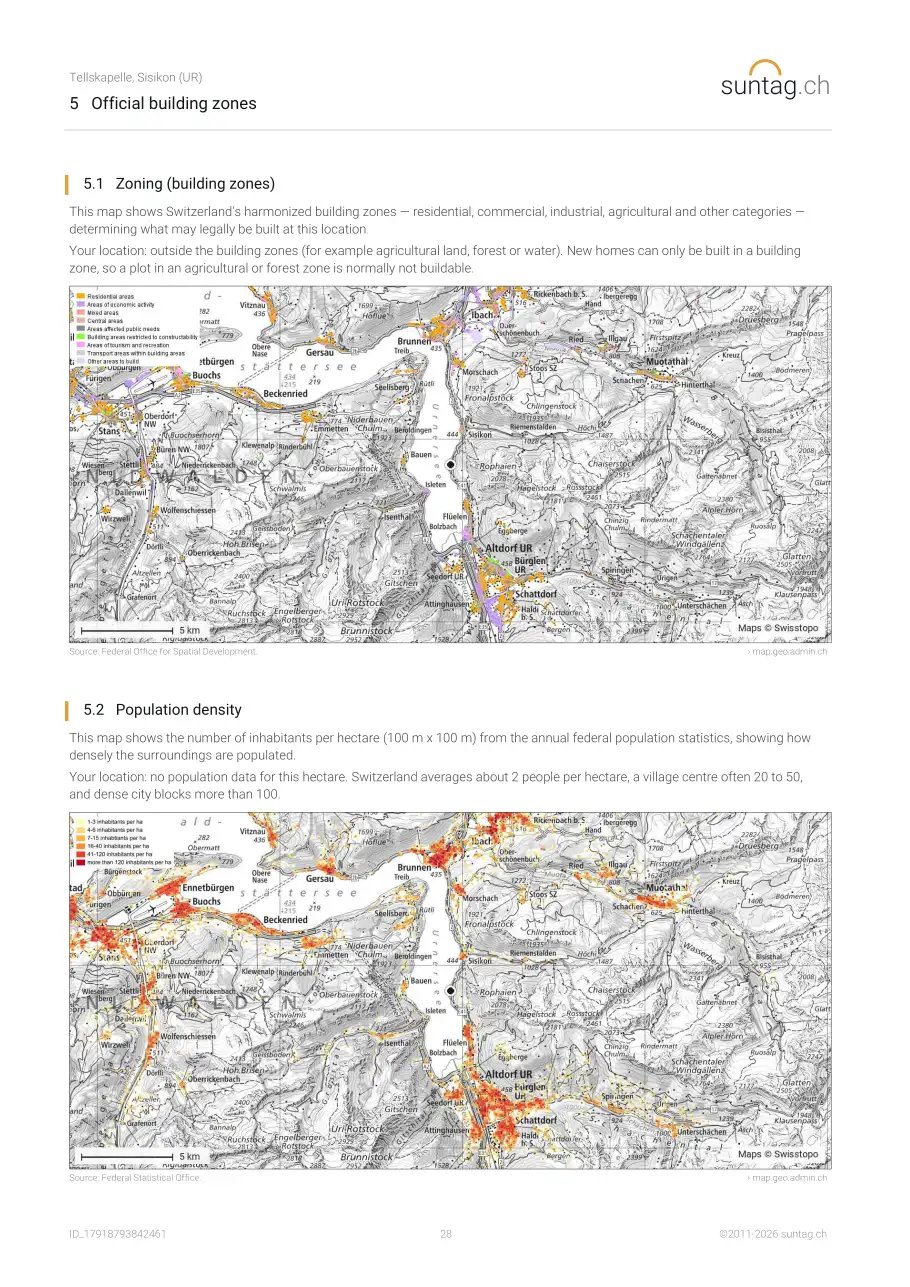
- 4.2 Zoning (building zones)
- 4.3 Heritage and protected areas nearby
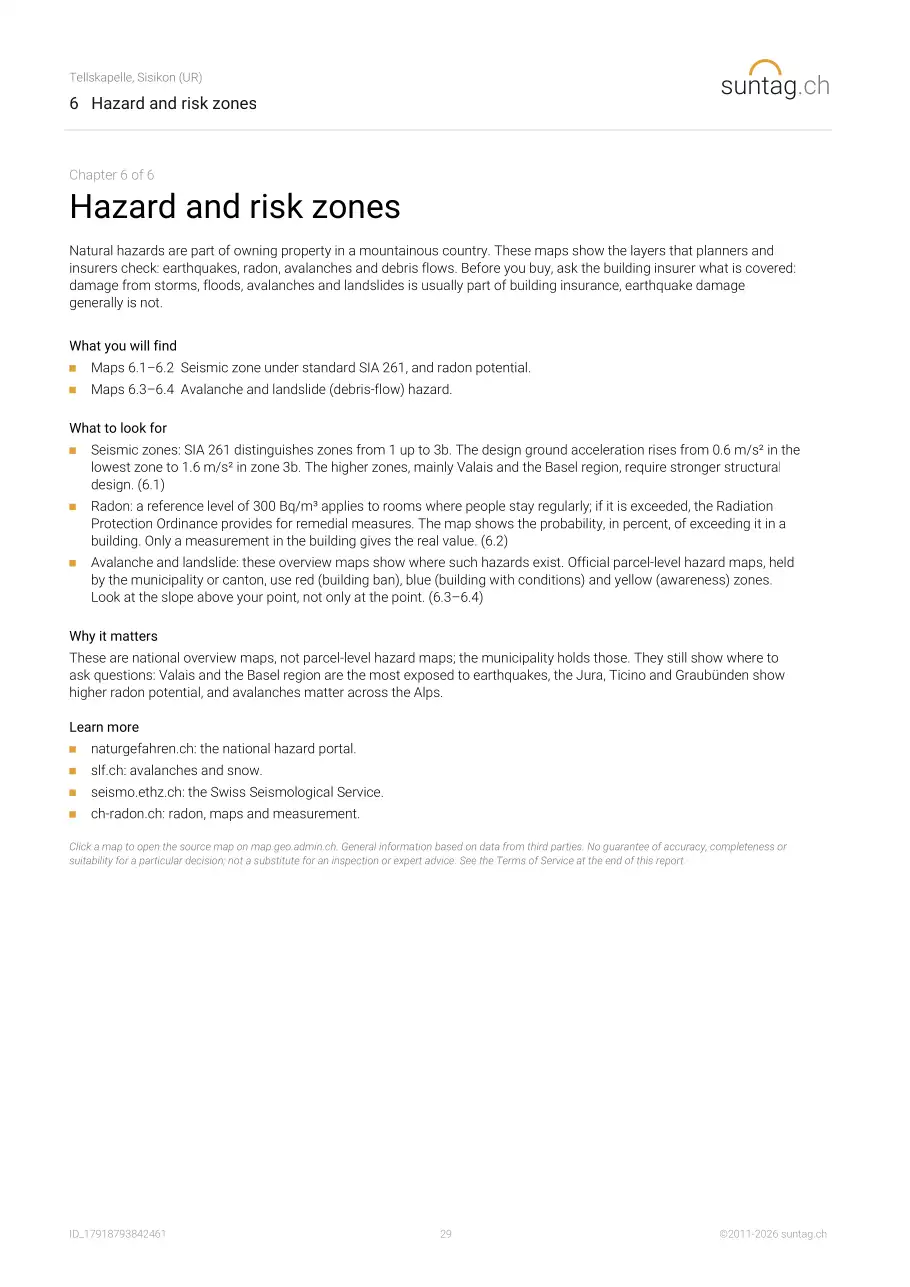
- 4.4 Population density
- 4.5 Road accidents with injury nearby
- 4.6 Contaminated sites
- 4.7 Major-accident areas
5 Radiation sources
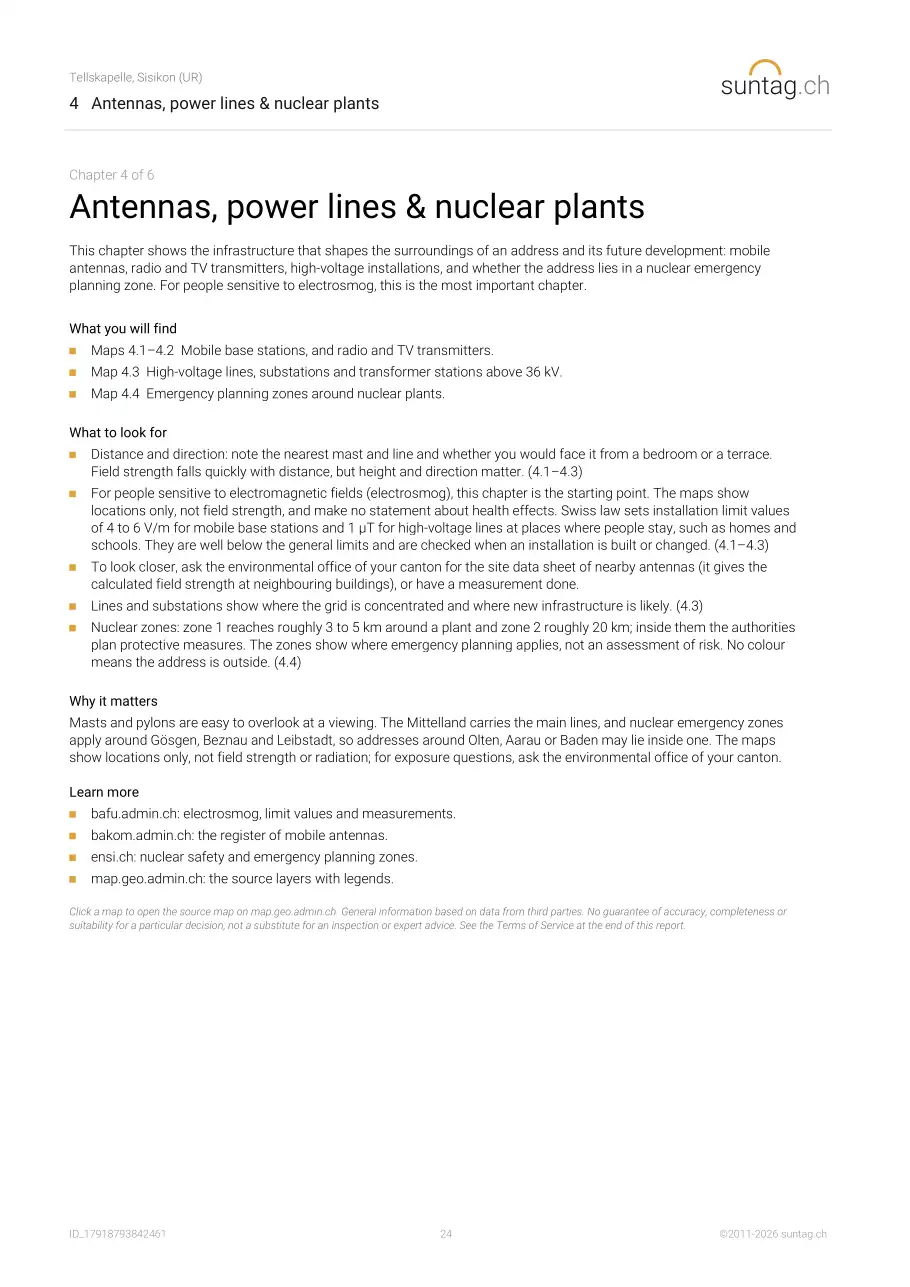
- 5.1 Mobile base stations
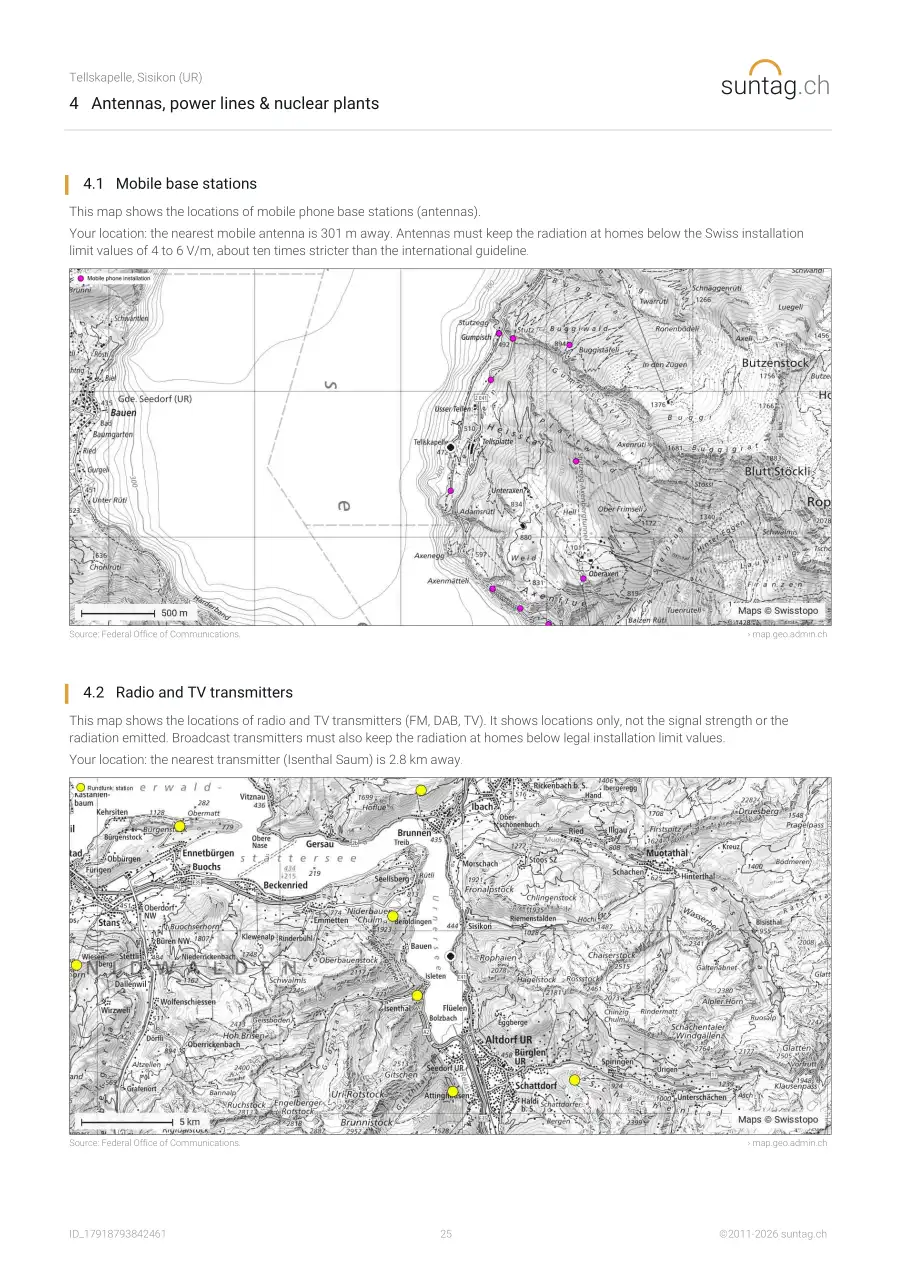
- 5.2 Radio and TV transmitters
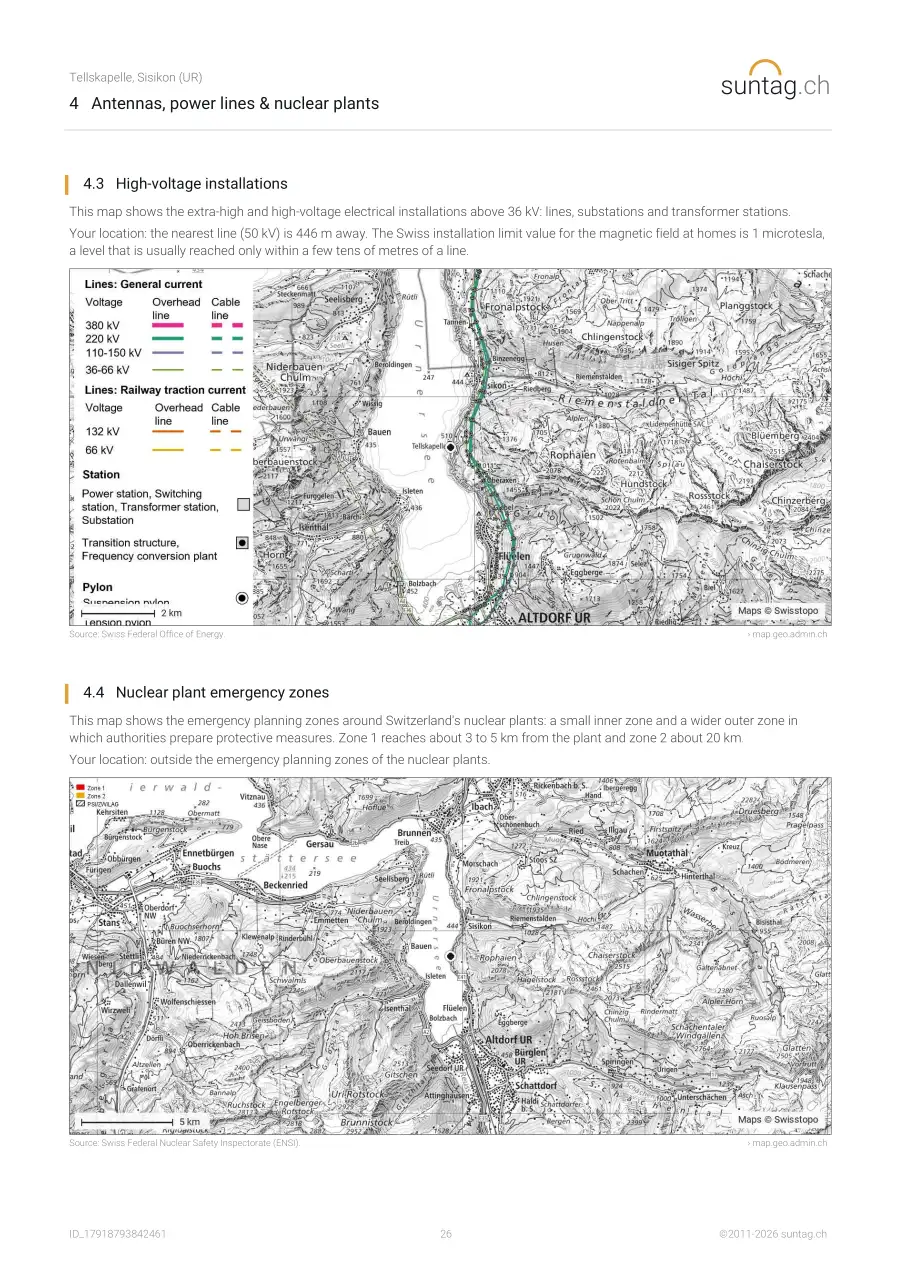
- 5.3 High-voltage installations
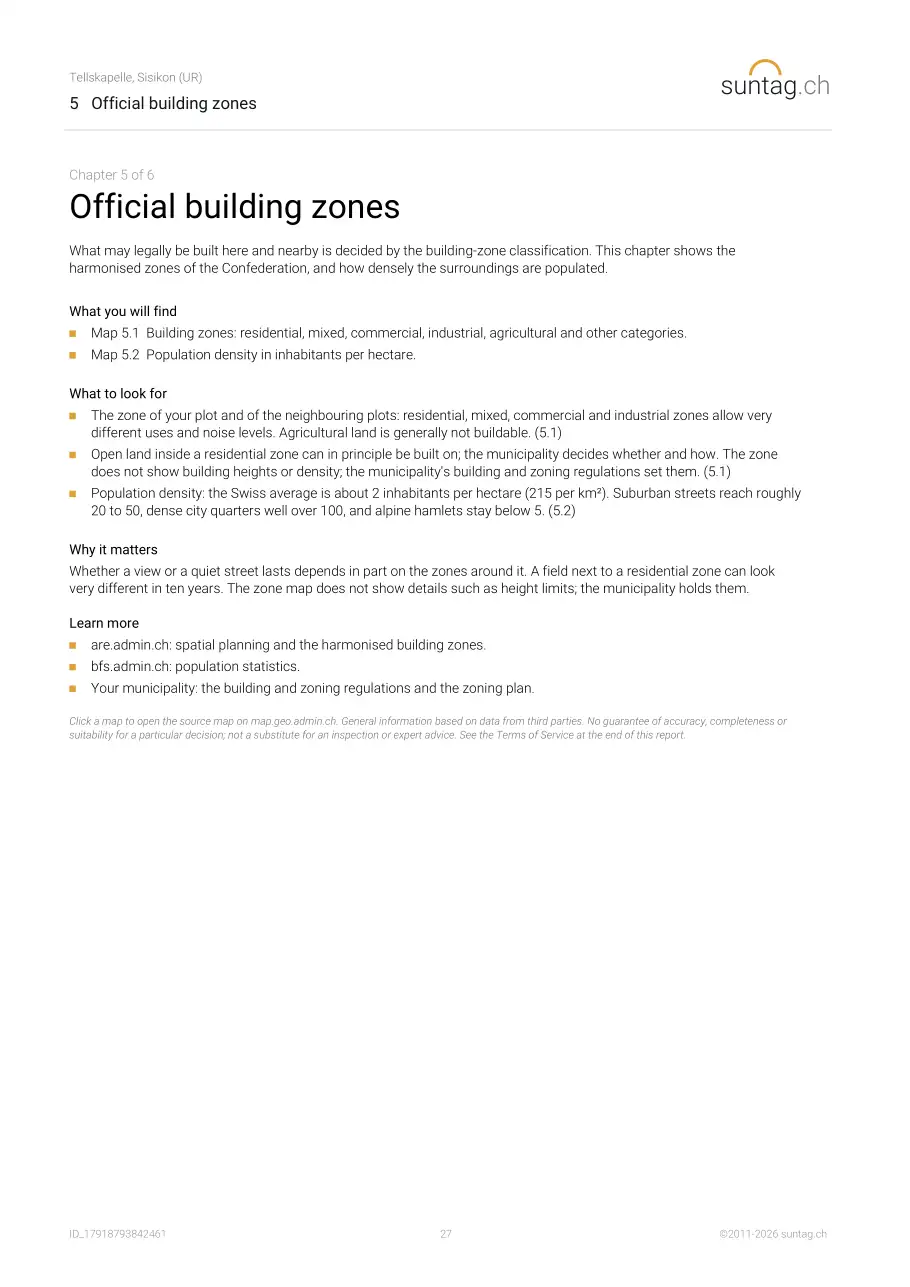
- 5.4 Nuclear plant emergency zones
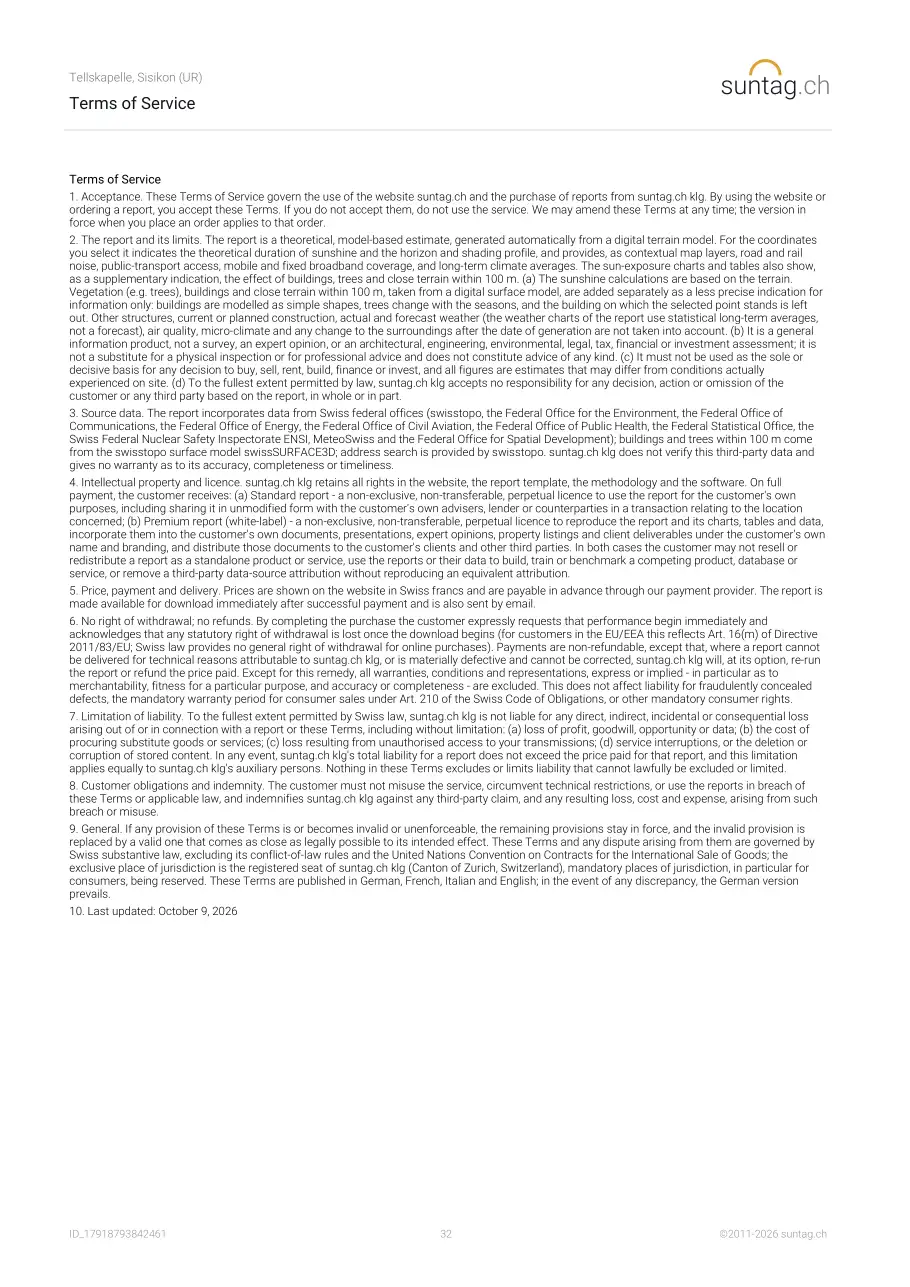
6 Hazards
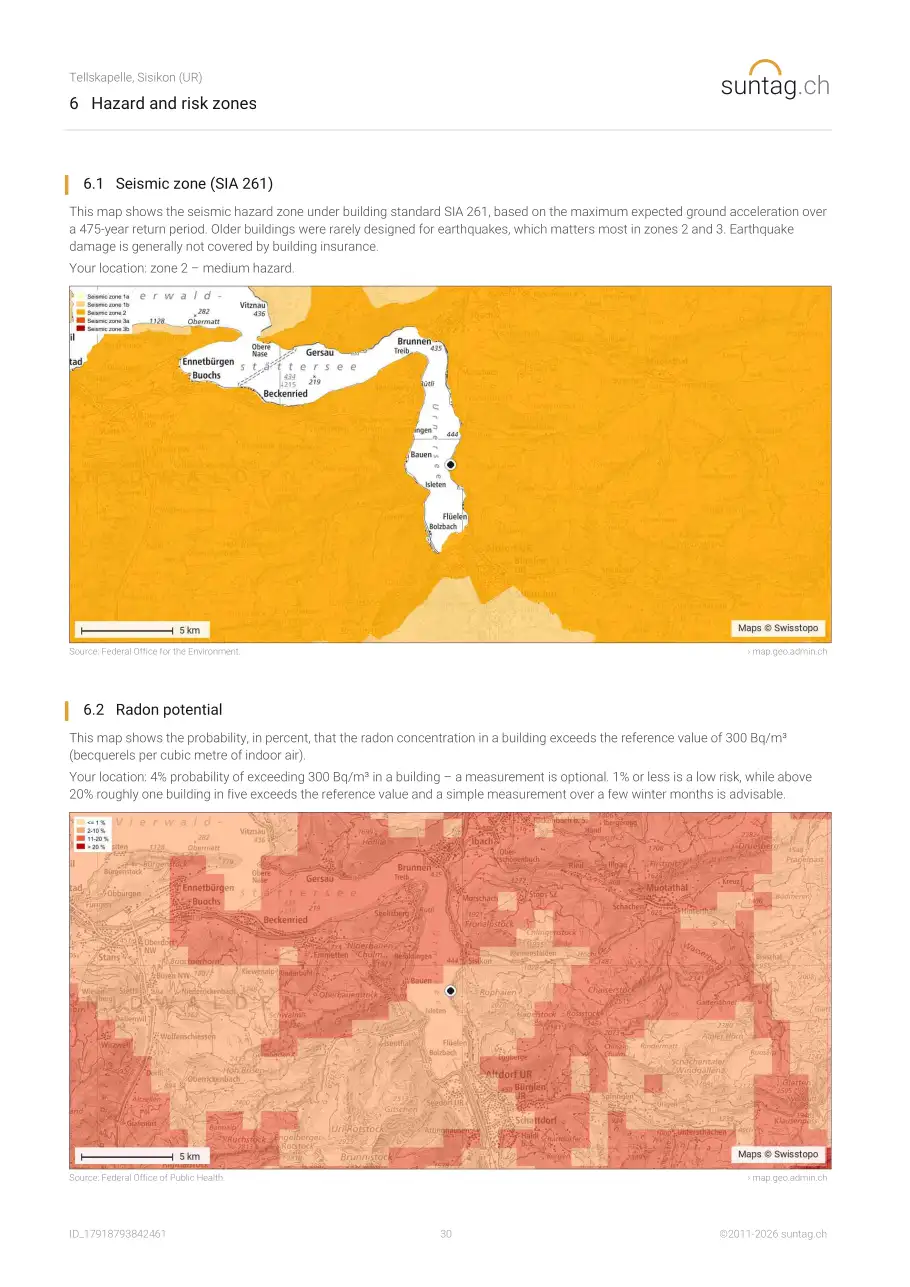
- 6.1 Seismic zone (SIA 261)
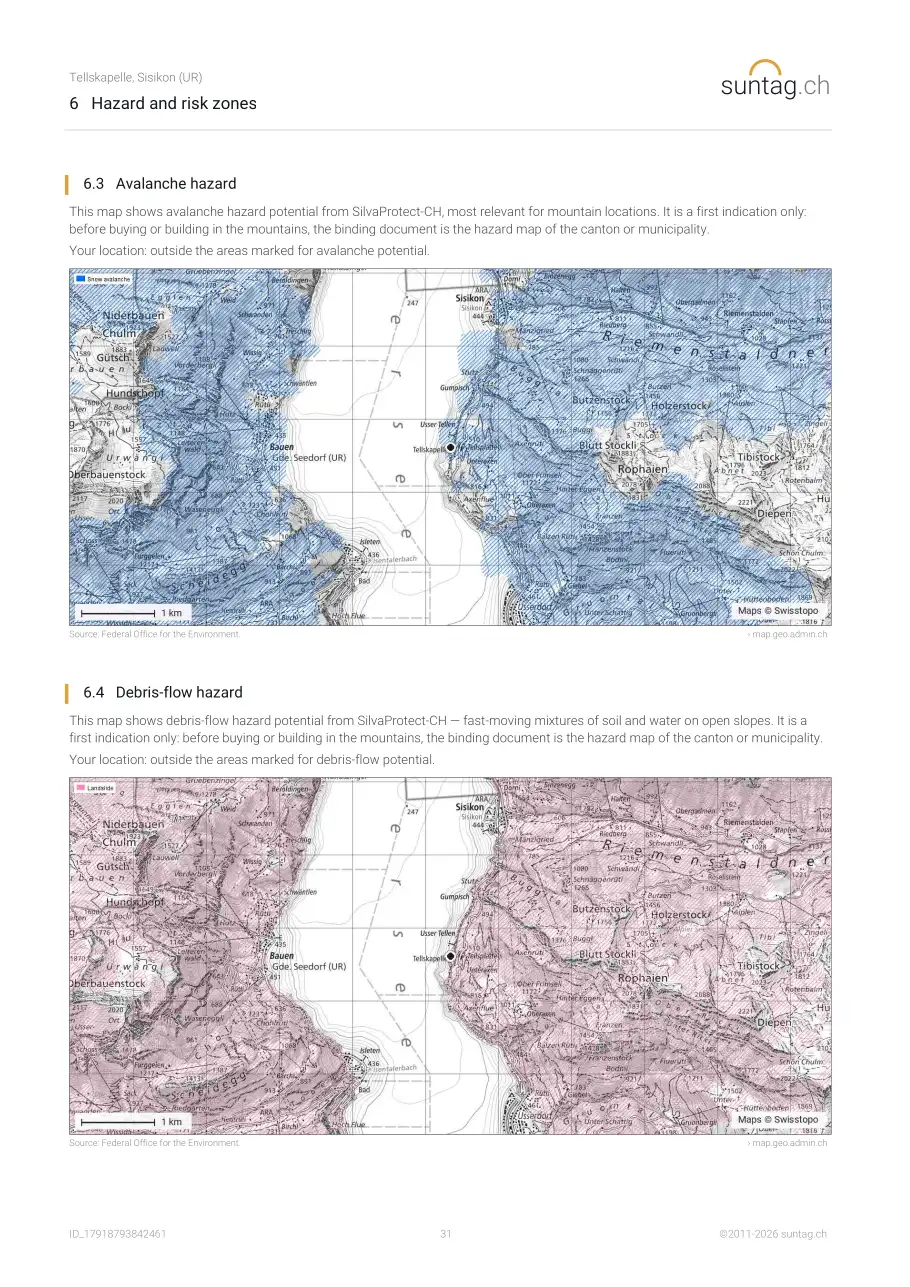
- 6.2 Radon potential
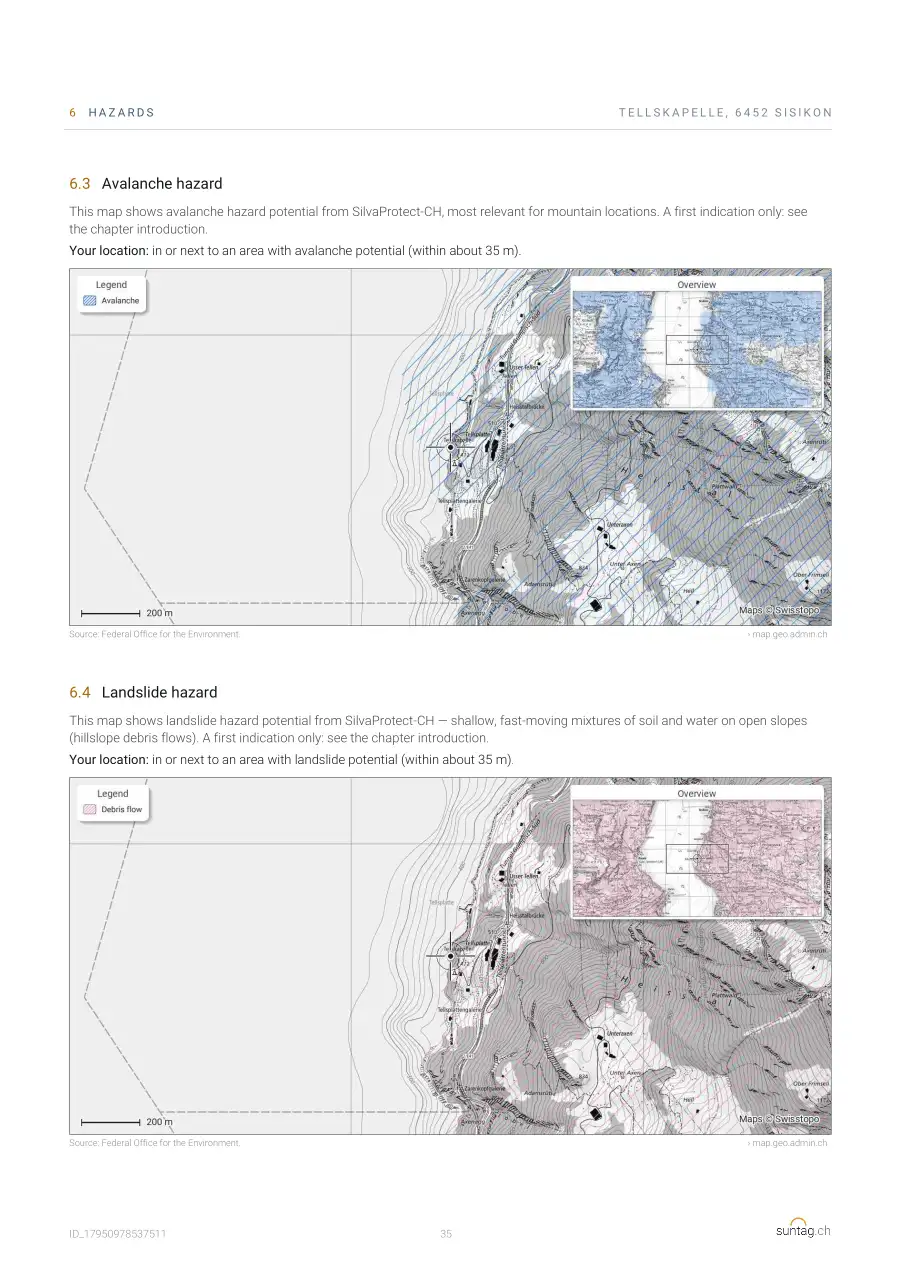
- 6.3 Avalanche hazard
- 6.4 Landslide hazard
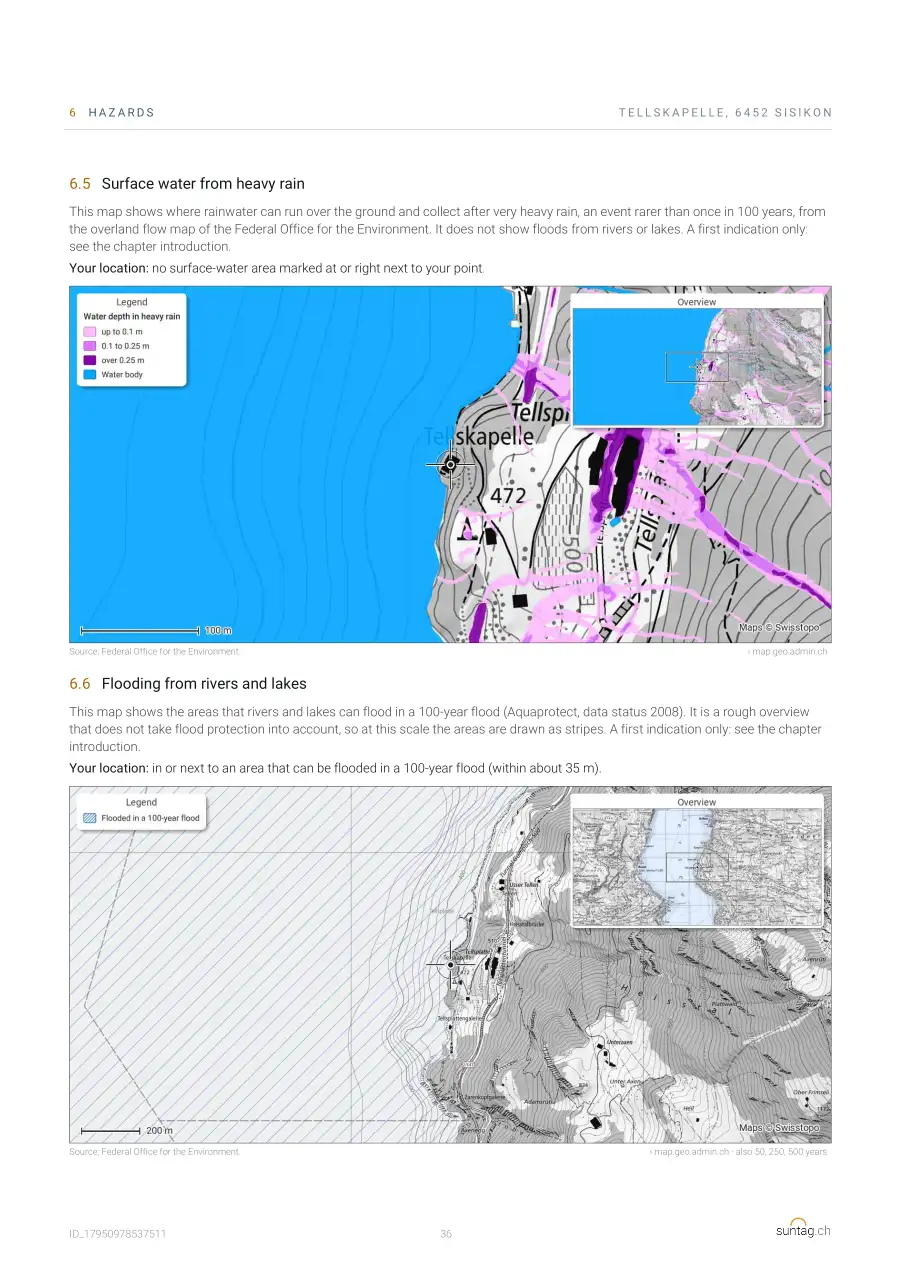
- 6.5 Surface water from heavy rain
- 6.6 Flooding from rivers and lakes
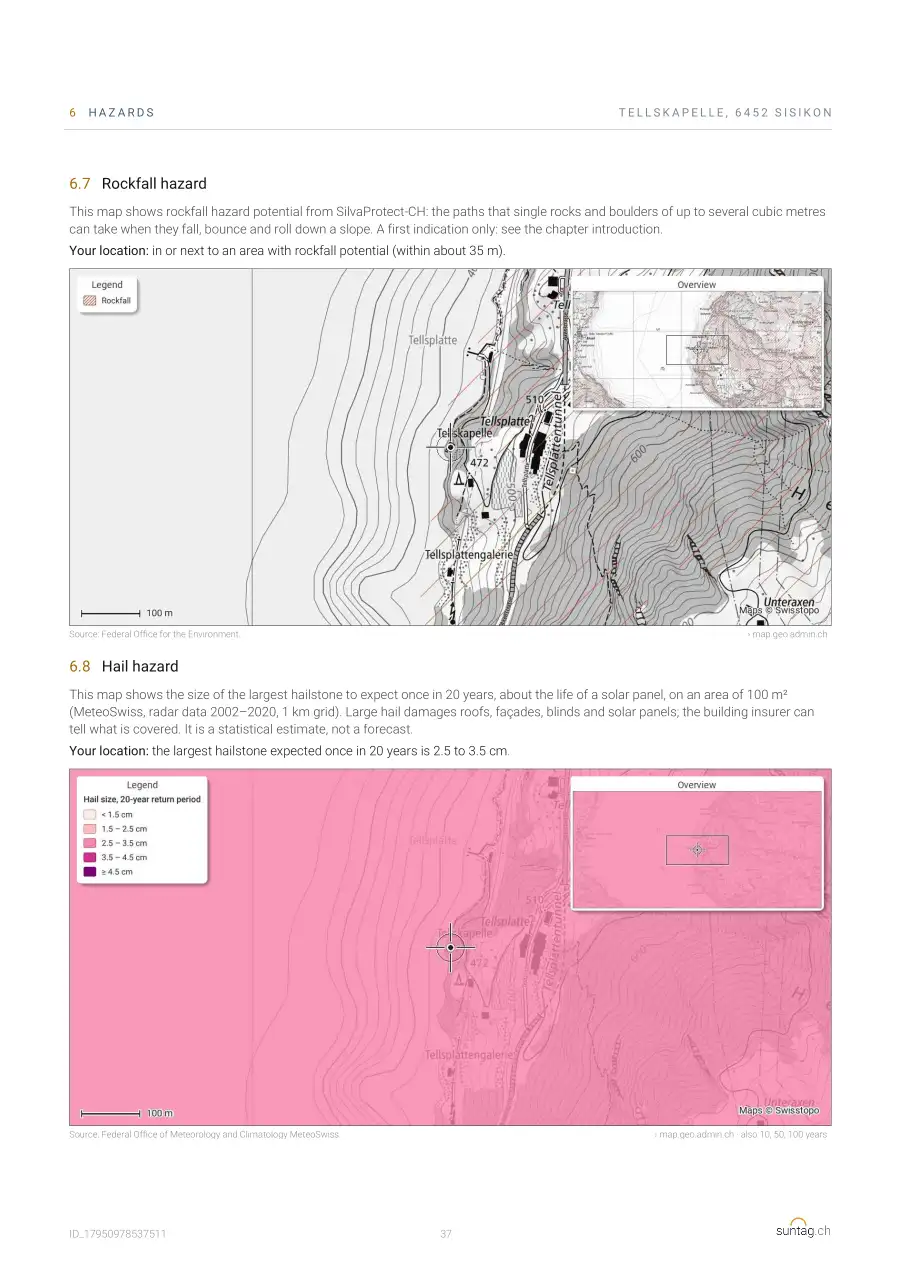
- 6.7 Rockfall hazard
- 6.8 Hail hazard
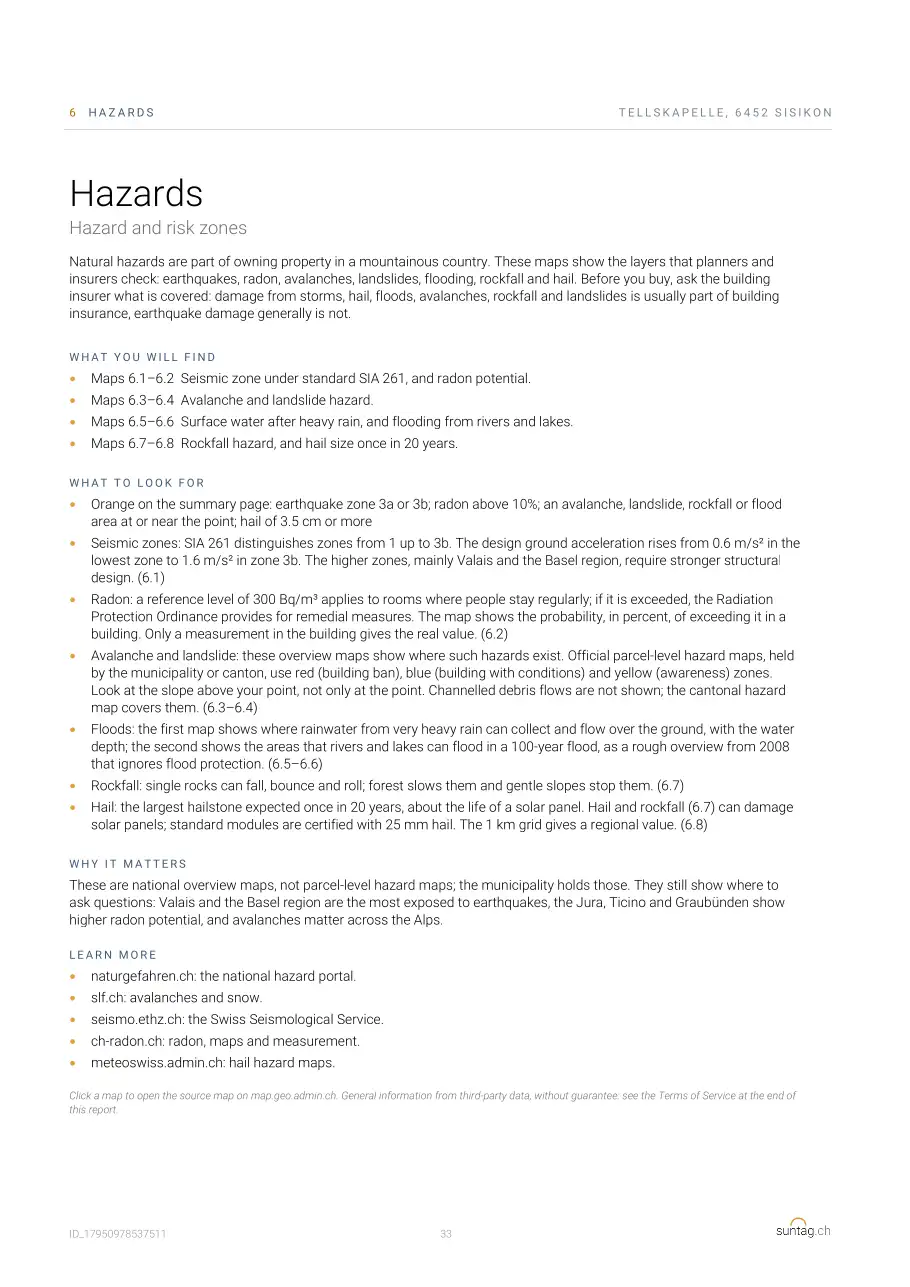
Terms of use
Your own report
Enter an address or drop the pin on the map: in about 10 seconds your 38-page report is ready. From CHF 15, no subscription.
Frequently asked questions about the sample report
Is this a real report?
Yes. It is made by exactly the same program as every customer report, for the coordinates of the Tellskapelle. It is made again whenever the report changes.
Why the Tellskapelle?
It lies at the foot of steep cliffs on Lake Uri: the mountains take a lot of sun, above all in winter. It shows well what the report does.
What is the difference between Standard and Premium?
The content is the same. Premium is landscape and without the suntag.ch logo, to pass on to your clients, with all charts and maps as pictures in a ZIP file.
Can I make the report for an upper floor?
Yes. Before the calculation you choose the floor; the eye height rises by 3 m per storey, and nearby buildings hide less sun.
More guides
- Sun exposure and sunshine hours
- Sunshine hours by city
- Noise: road, rail, aircraft
- Connectivity: transport, fibre, 5G
- Antennas, power lines, nuclear plants
- Building zones and population density
- Natural hazards: earthquakes, radon, avalanches
- Method and data
- Property checklist for Switzerland
Data and method: How the values are calculated and where the data come from: see the page Method and data.