What exactly is a suntag.ch report?
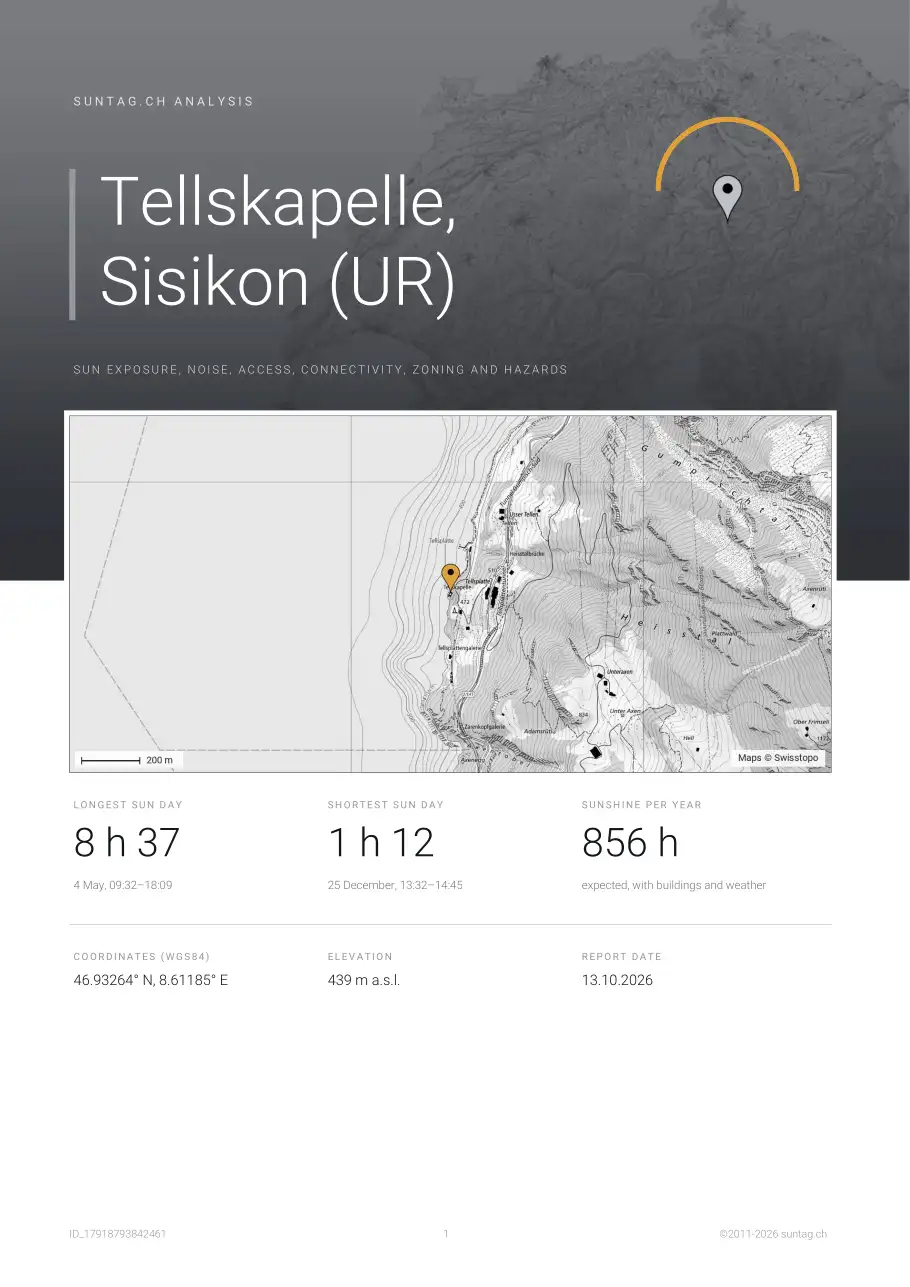
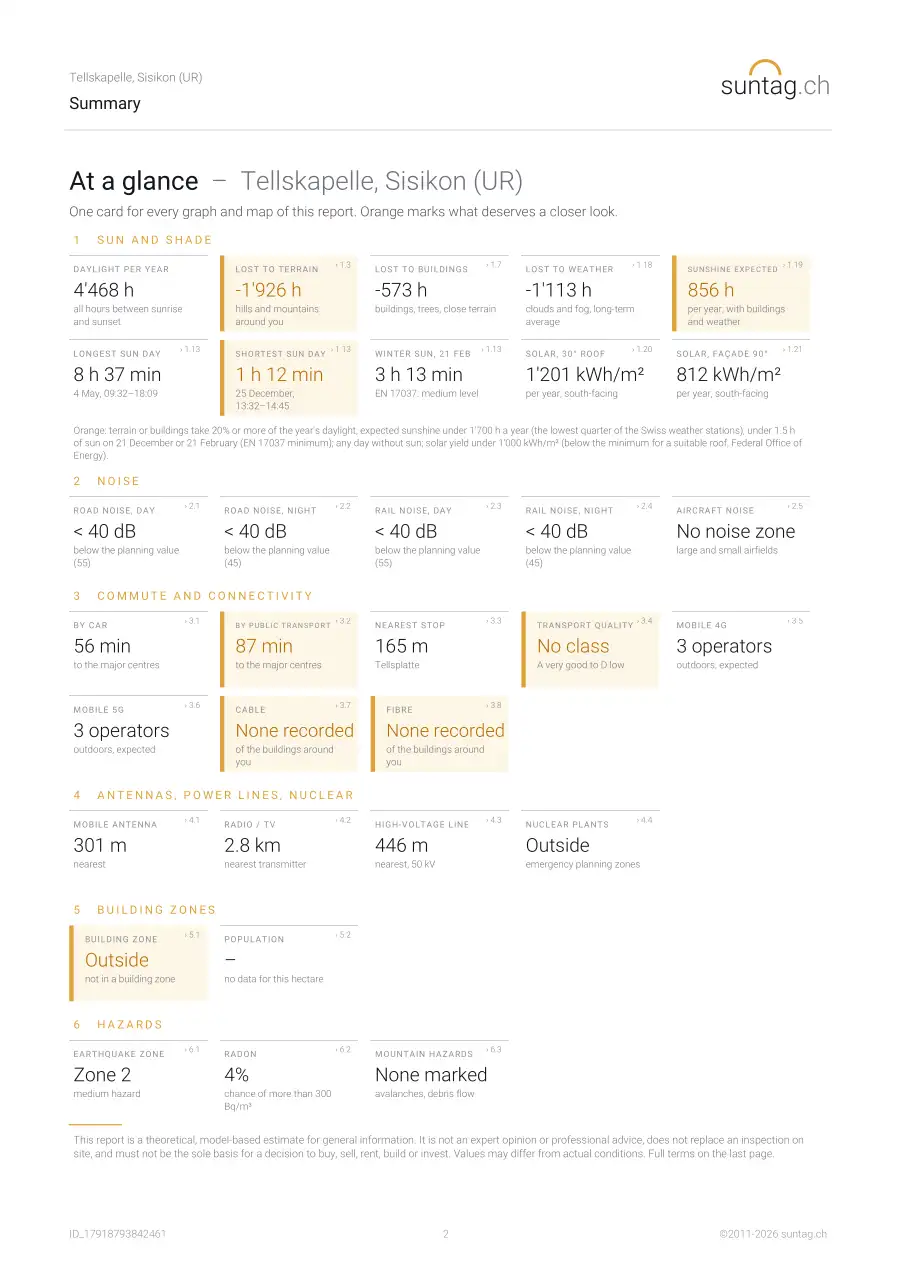
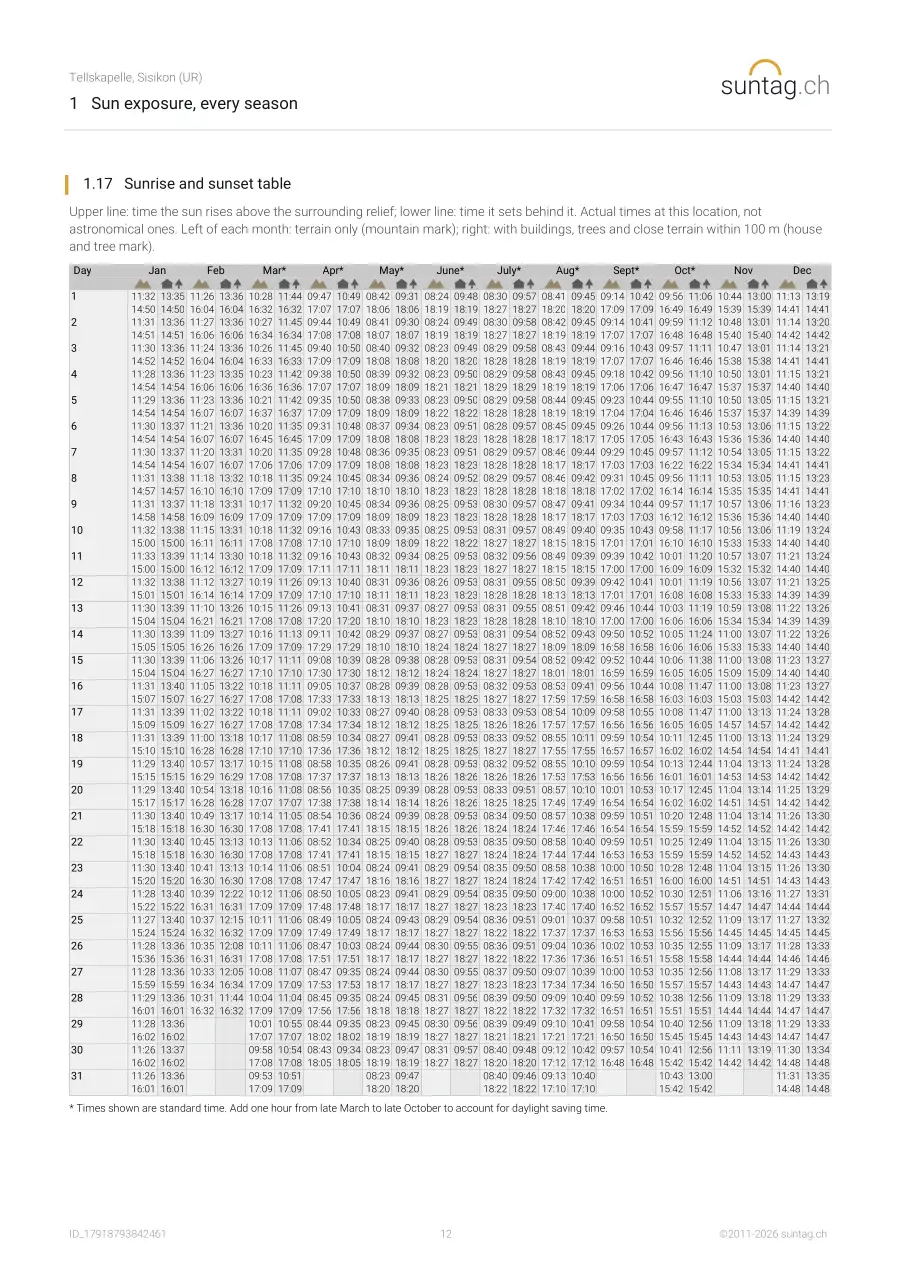
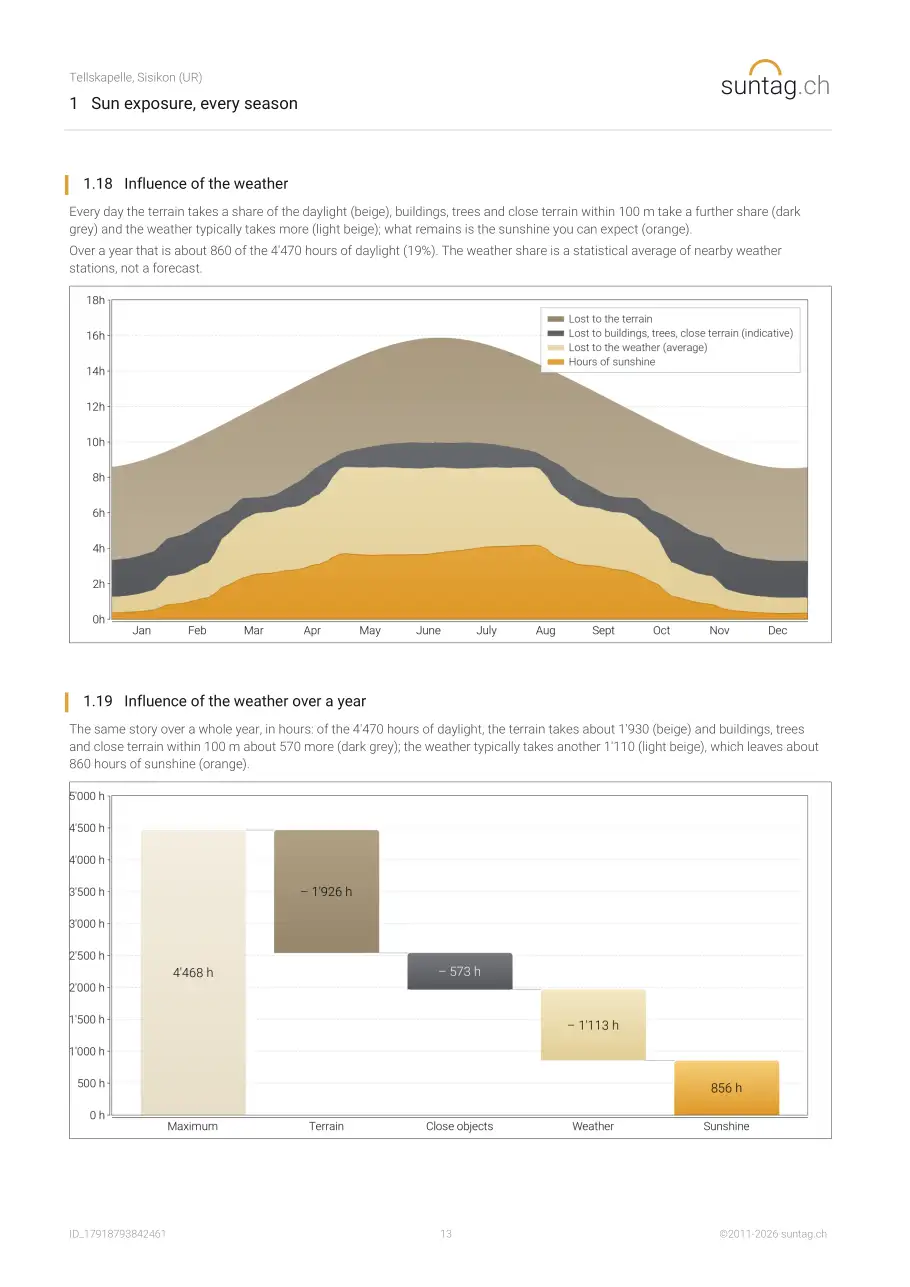
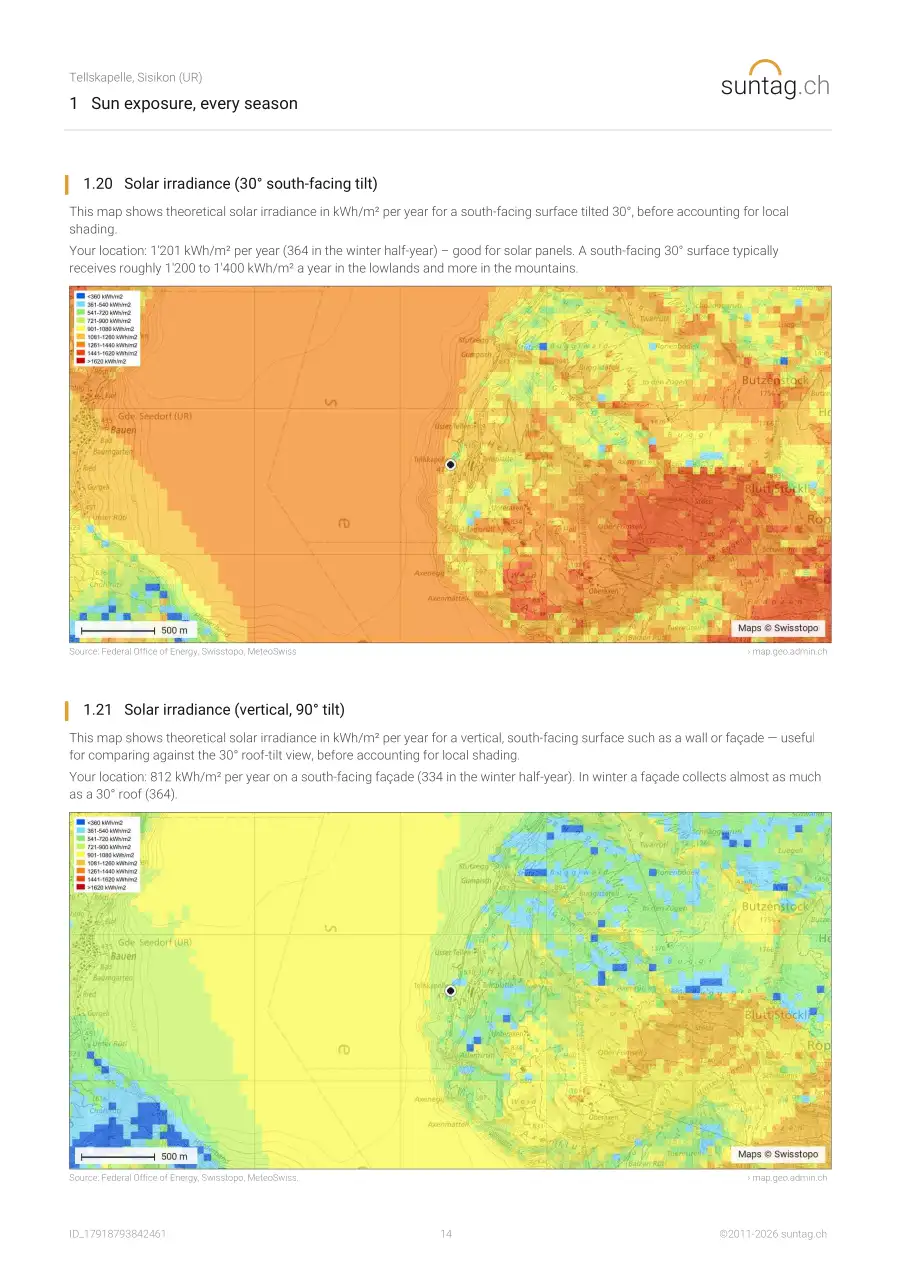
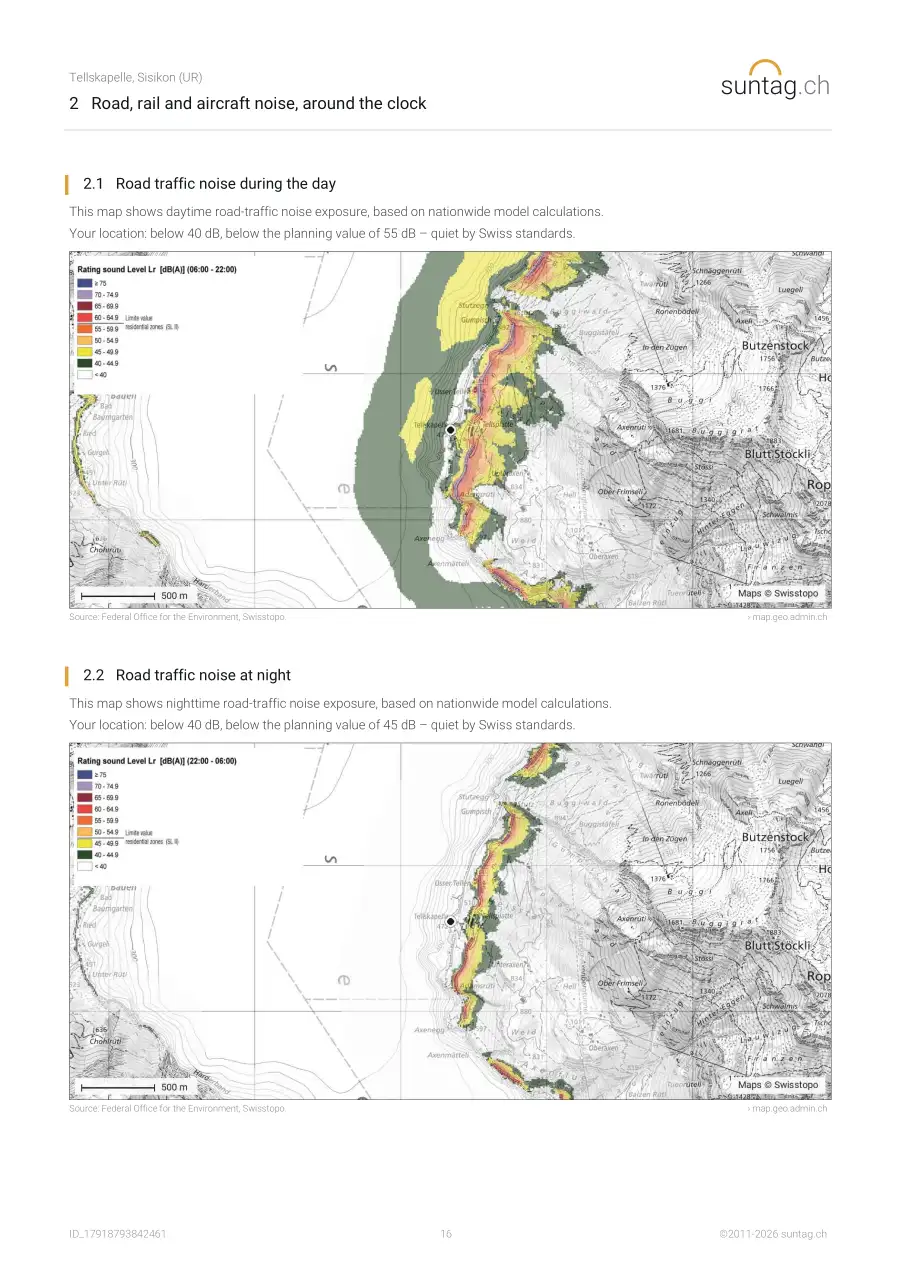
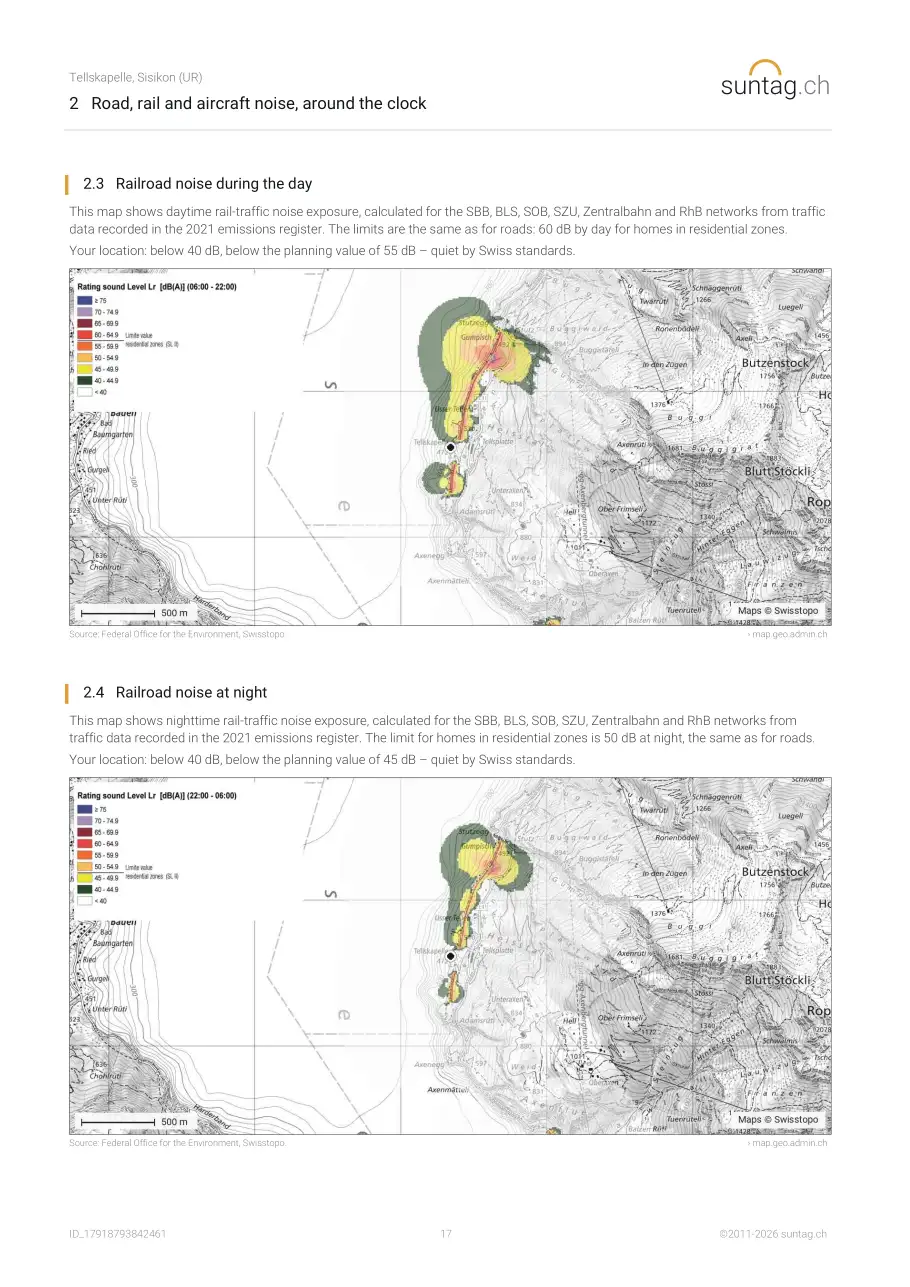
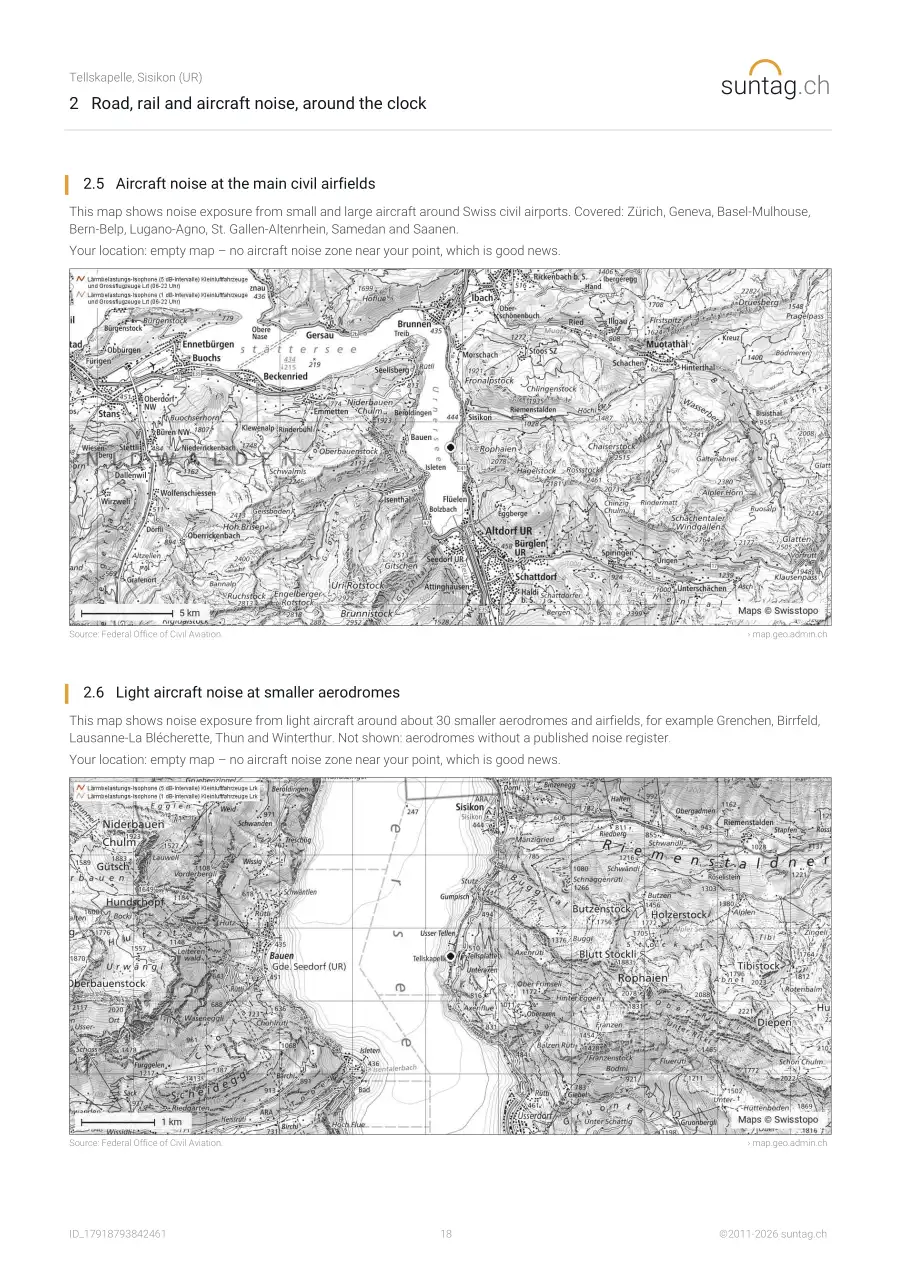
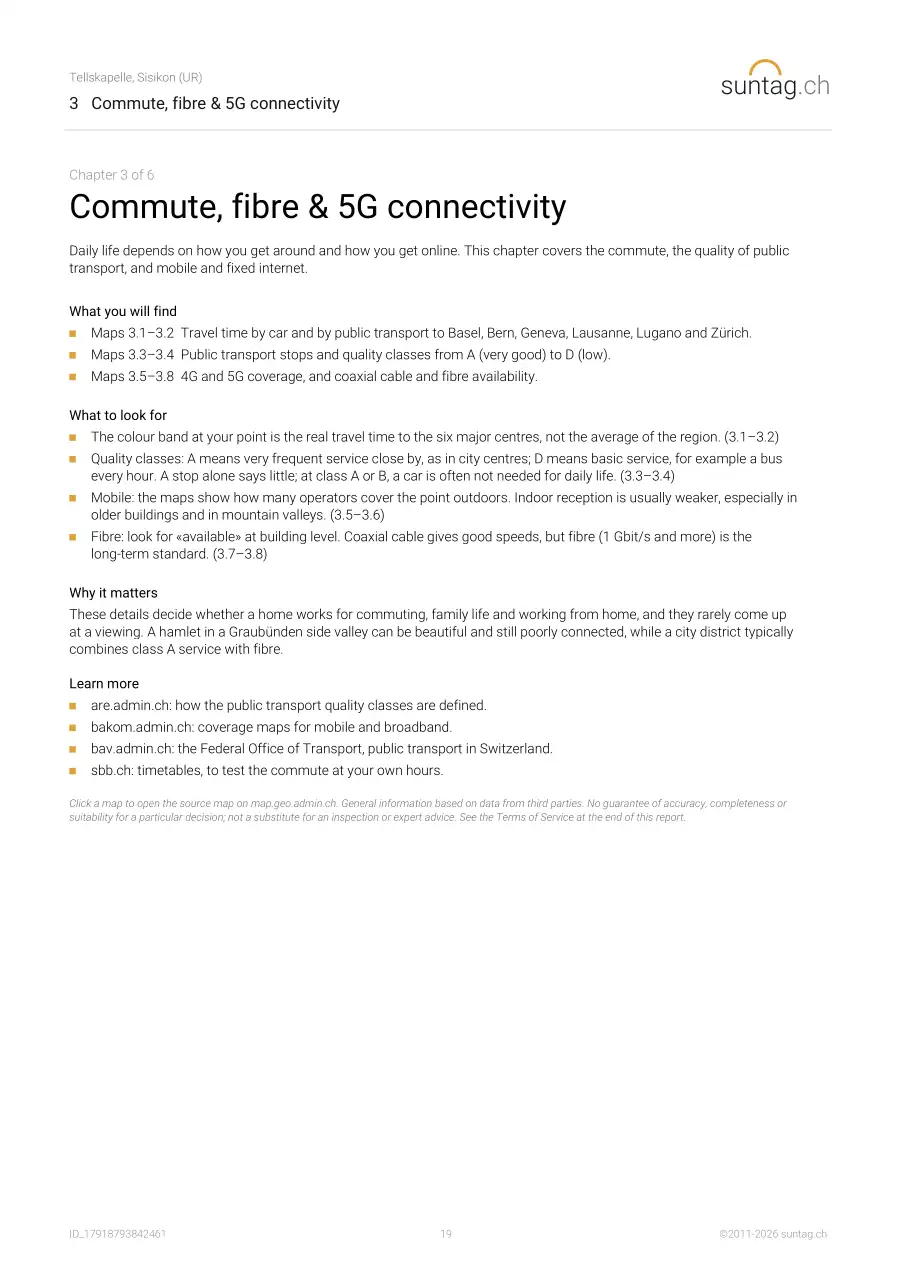
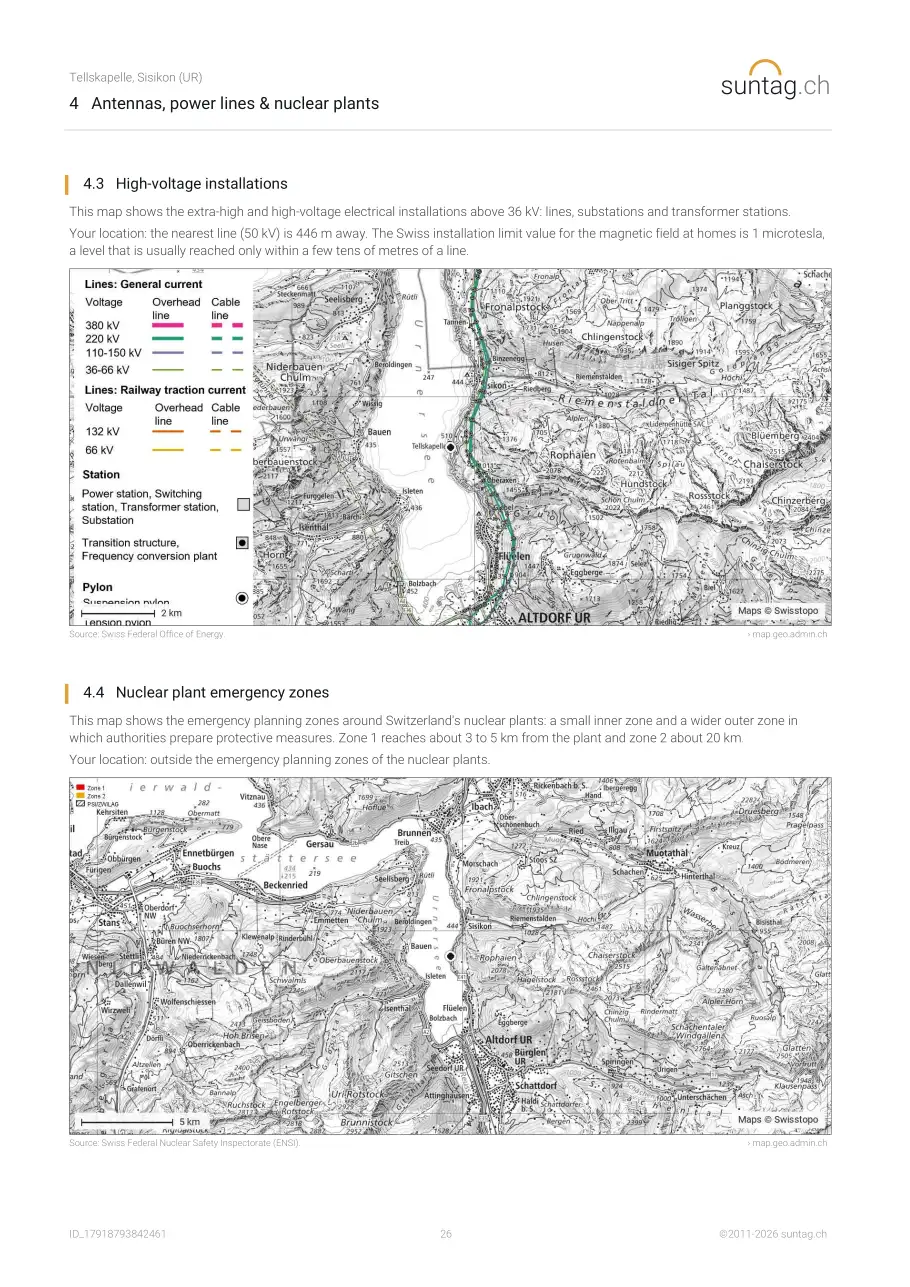
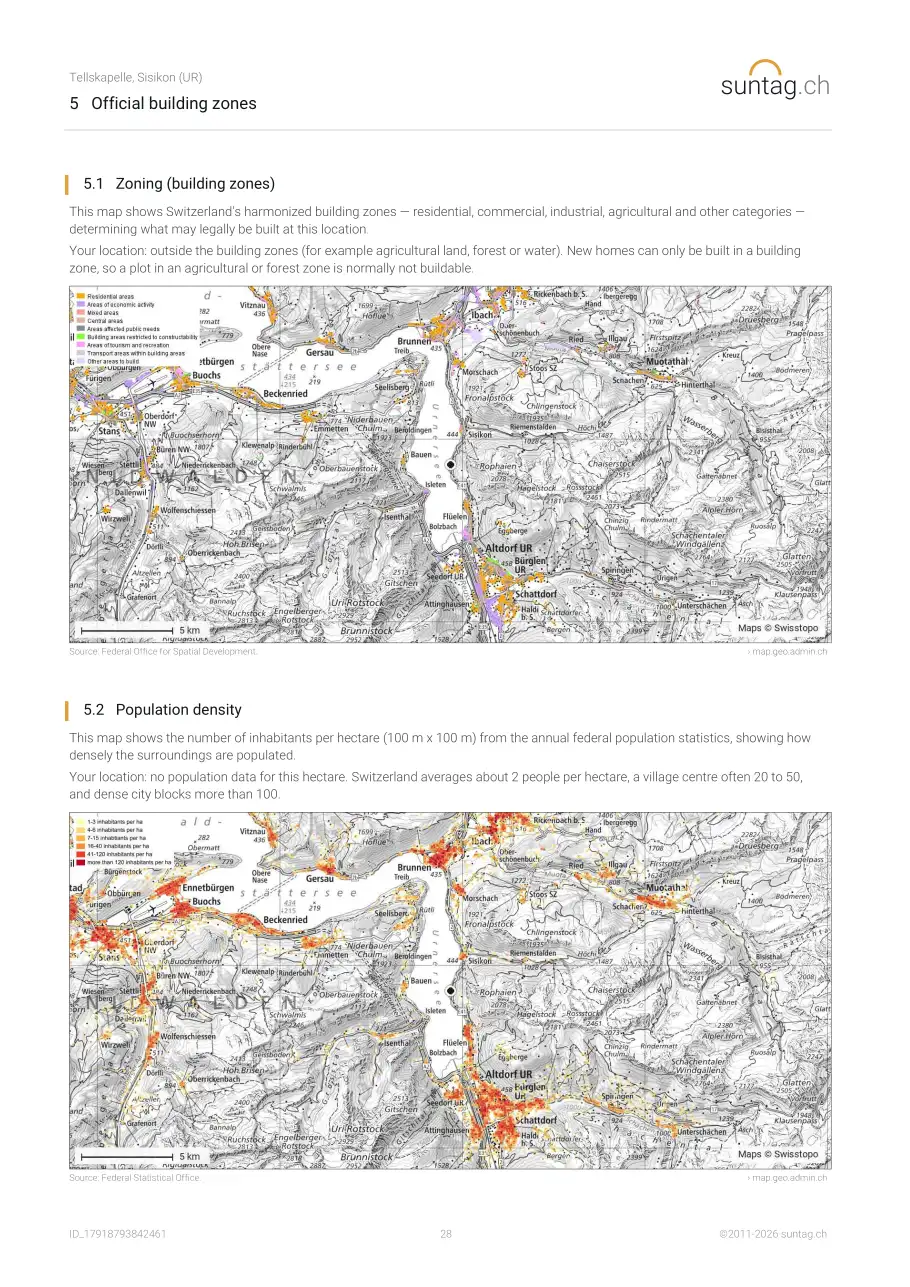
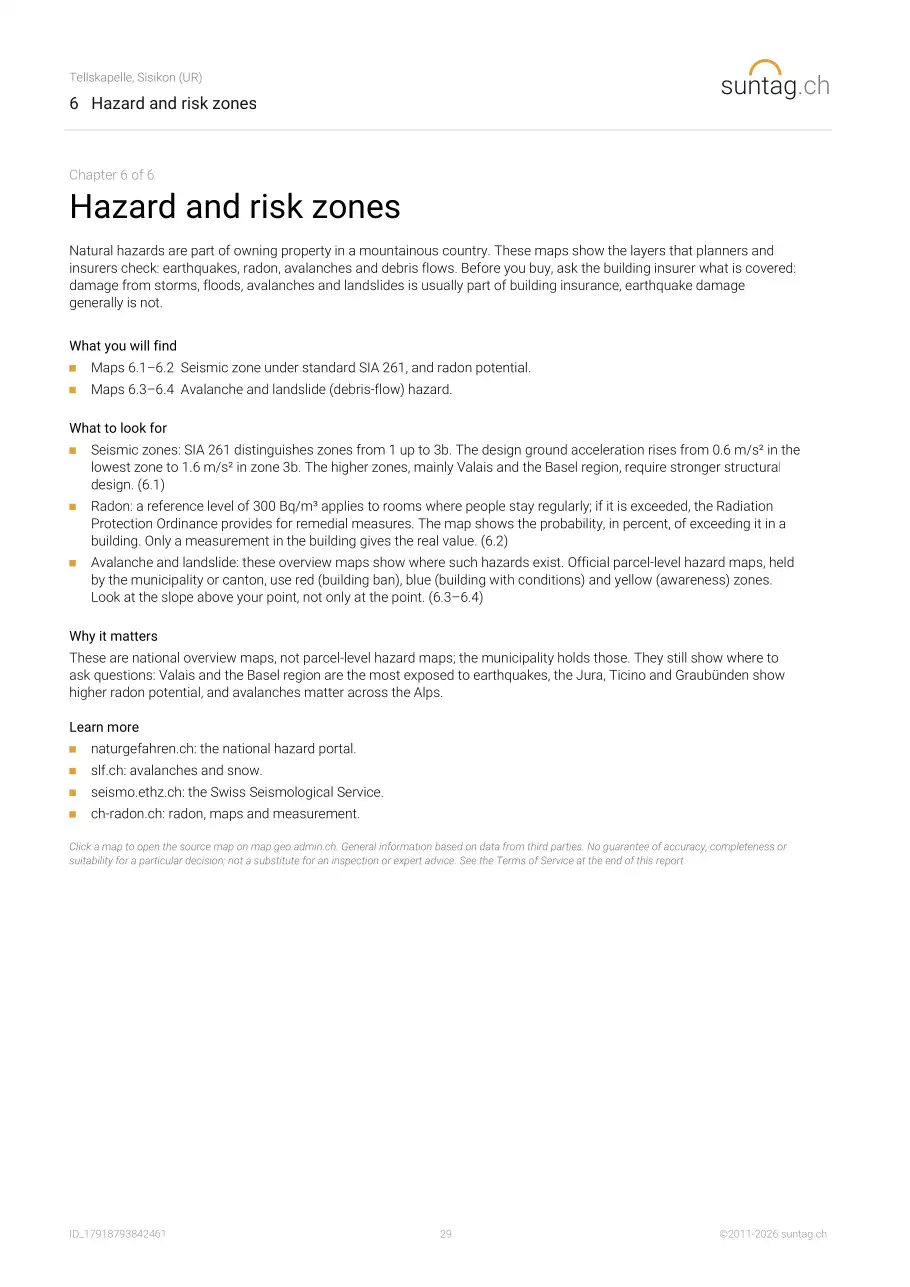
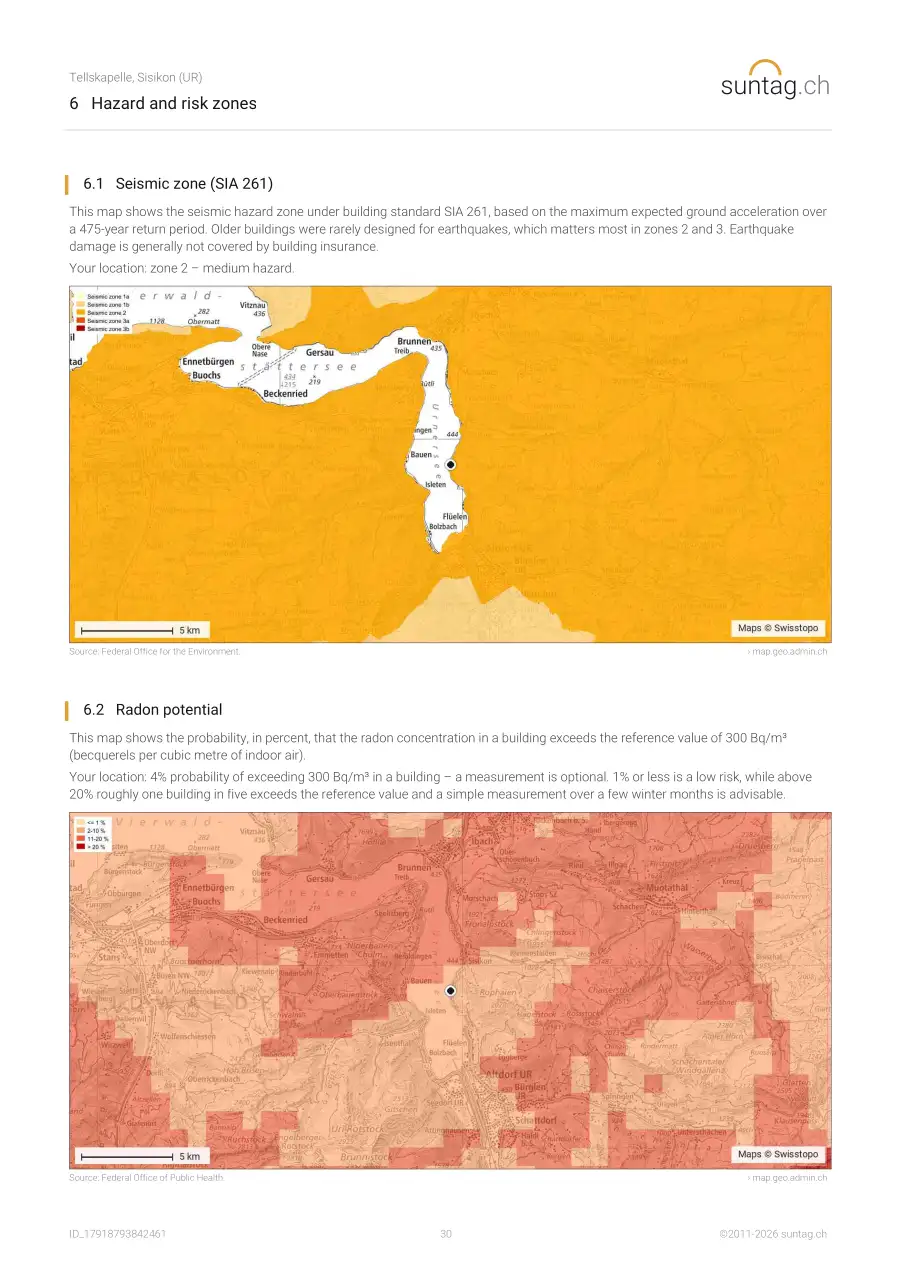
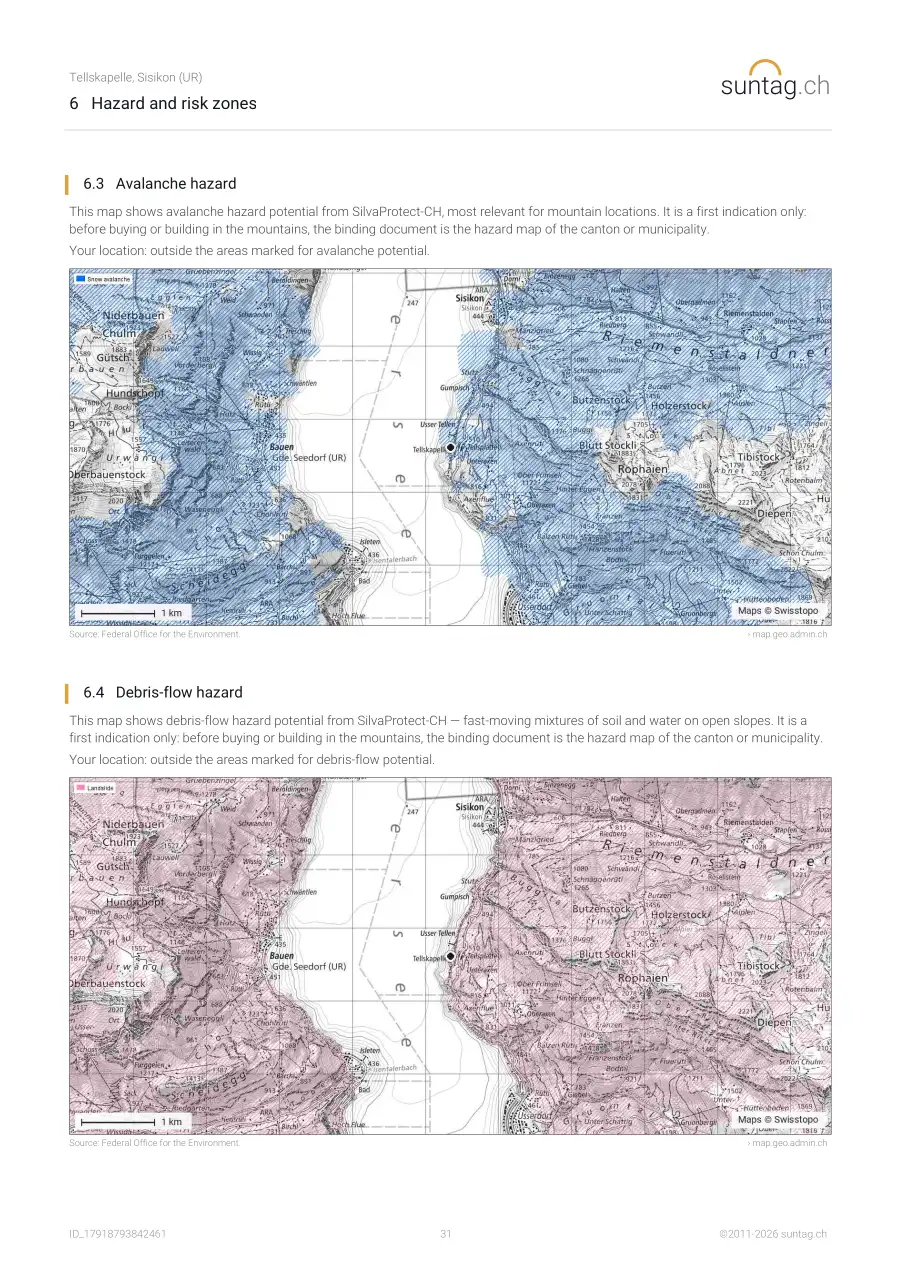
A 32-page PDF analysis of a single location in Switzerland or Liechtenstein, with 12 charts, 31 maps and 3 tables, ready in less than ten seconds. At its core is a study of sun exposure and shading – how much sunlight the location receives throughout the year, and how the surrounding terrain reduces it from season to season, plus where the sun stands hour by hour. The report also covers the layers that shape everyday life there: road, rail and aircraft noise, car and public-transport access with service quality, mobile antennas, radio and TV transmitters, high-voltage installations, nuclear-plant emergency zones, mobile and broadband coverage, solar potential, official building-zone classification, population density, seismic, radon, avalanche and landslide risk, and long-term climate averages. The sunshine charts and tables, the horizon and the sun's position by time of day also show, as a less precise indication, the effect of the buildings, trees and close terrain within 100 m.
What is sun exposure, and why does it matter?
Sun exposure is how much direct sunlight a location actually receives over the year – governed by the season, the sun's path, and the hills, ridges or mountains that sit on its horizon. It influences daylight, heating and cooling needs, and how much use you'll get out of a south-facing balcony. suntag.ch calculates it for any Swiss address, day by day across the whole year, from the real terrain model published by swisstopo – not just the astronomical sun position simpler calculators use. See our
sun exposure guide for Switzerland for the full breakdown.
What should I check about a property's location before buying or renting?
Besides the condition and floor plan, the location matters too: sun and daylight; noise from road, rail and aircraft; access by car and public transport, mobile and fibre; antennas, power lines and nuclear emergency zones; the building zone; and natural hazards such as earthquakes, radon, avalanches and landslides. Our
property checklist for Switzerland walks you through all six areas, with reference values and official sources, and you can tick it off during the viewing.
How many hours of sunshine does a house need?
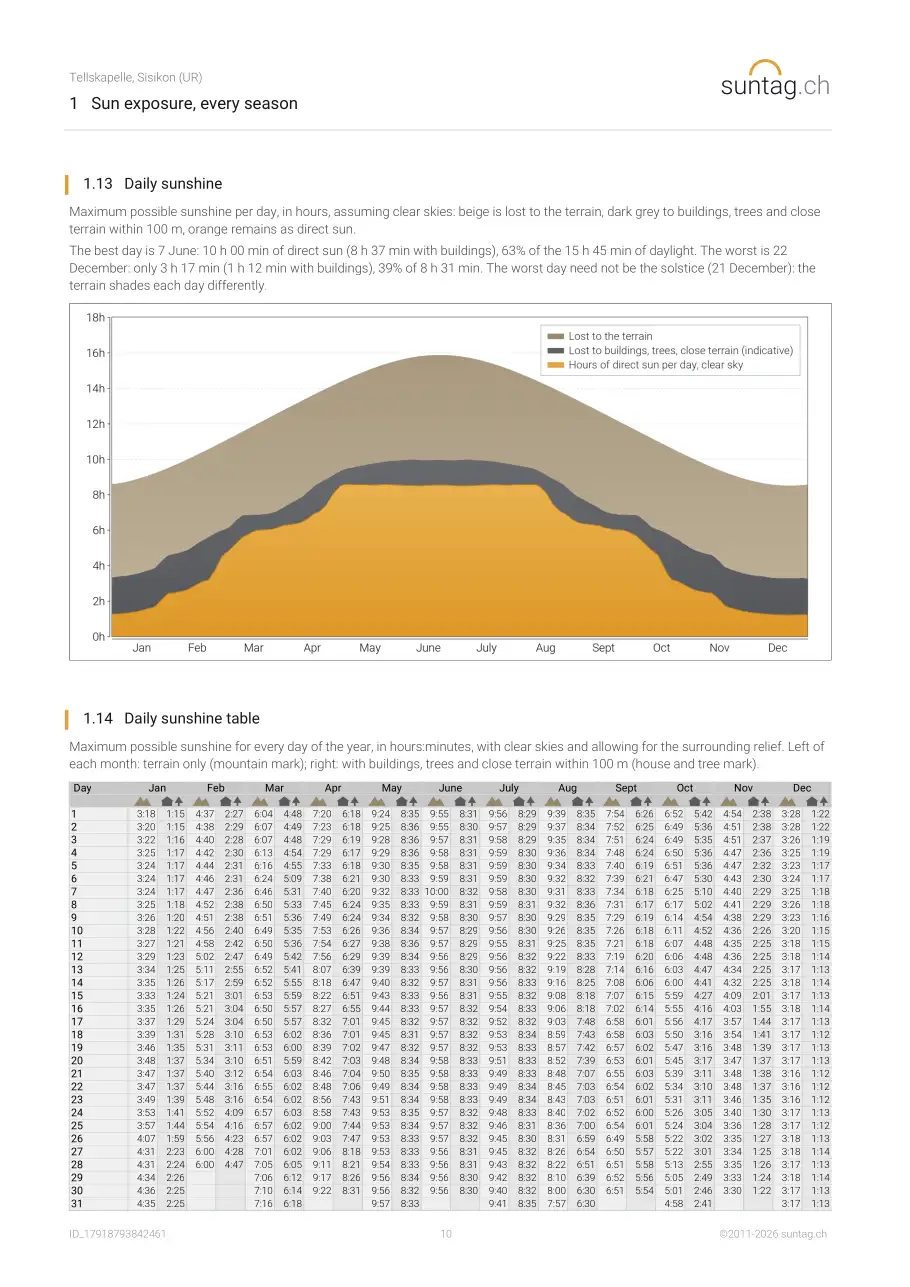
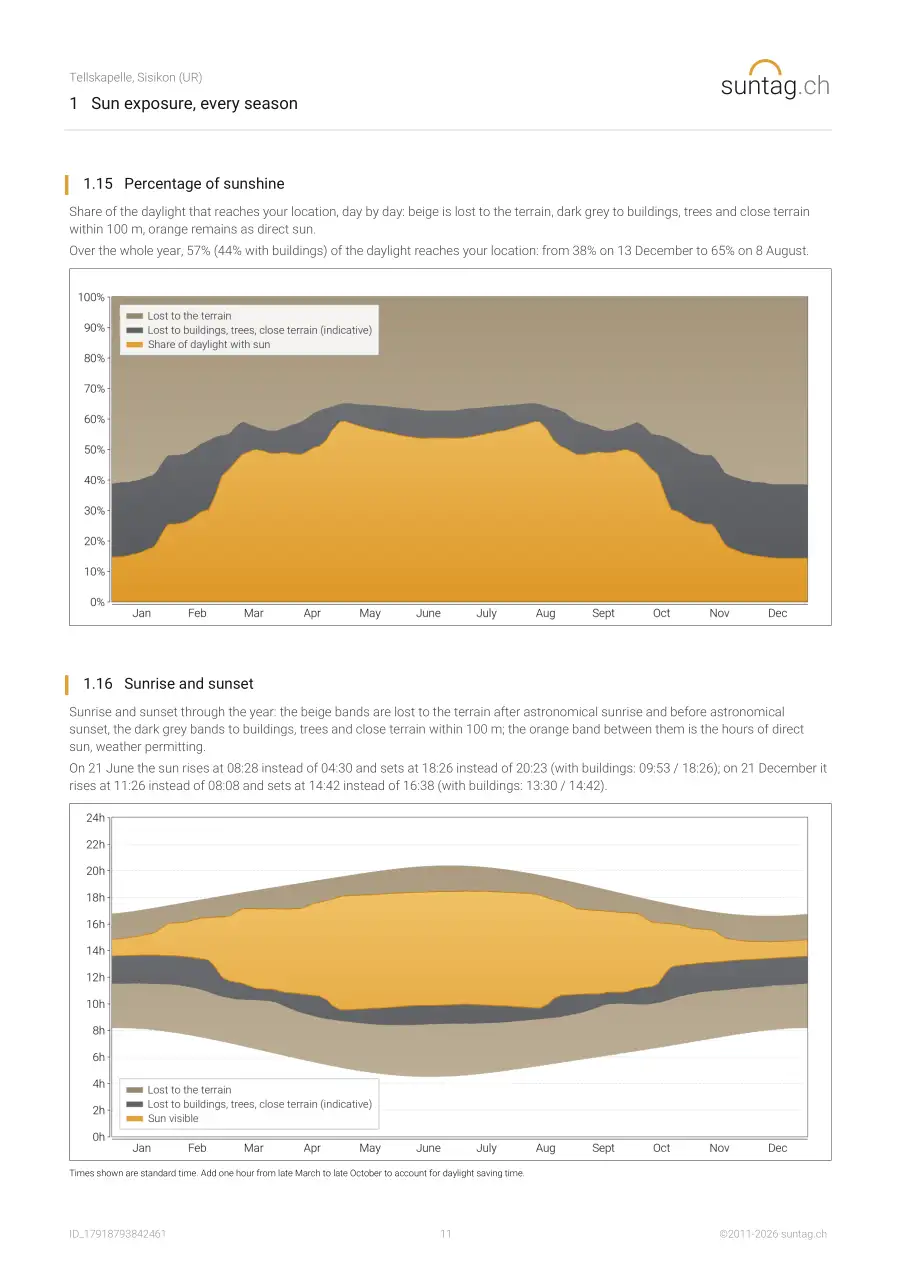
Several hours of direct sun, even in winter, contribute to living comfort; pure north-facing or heavily shaded valley locations score markedly worse. The suntag.ch report shows the effective sun exposure of your location month by month, including the critical winter months from November to February, when surrounding mountains and hills block the sun the longest.
How is it calculated?
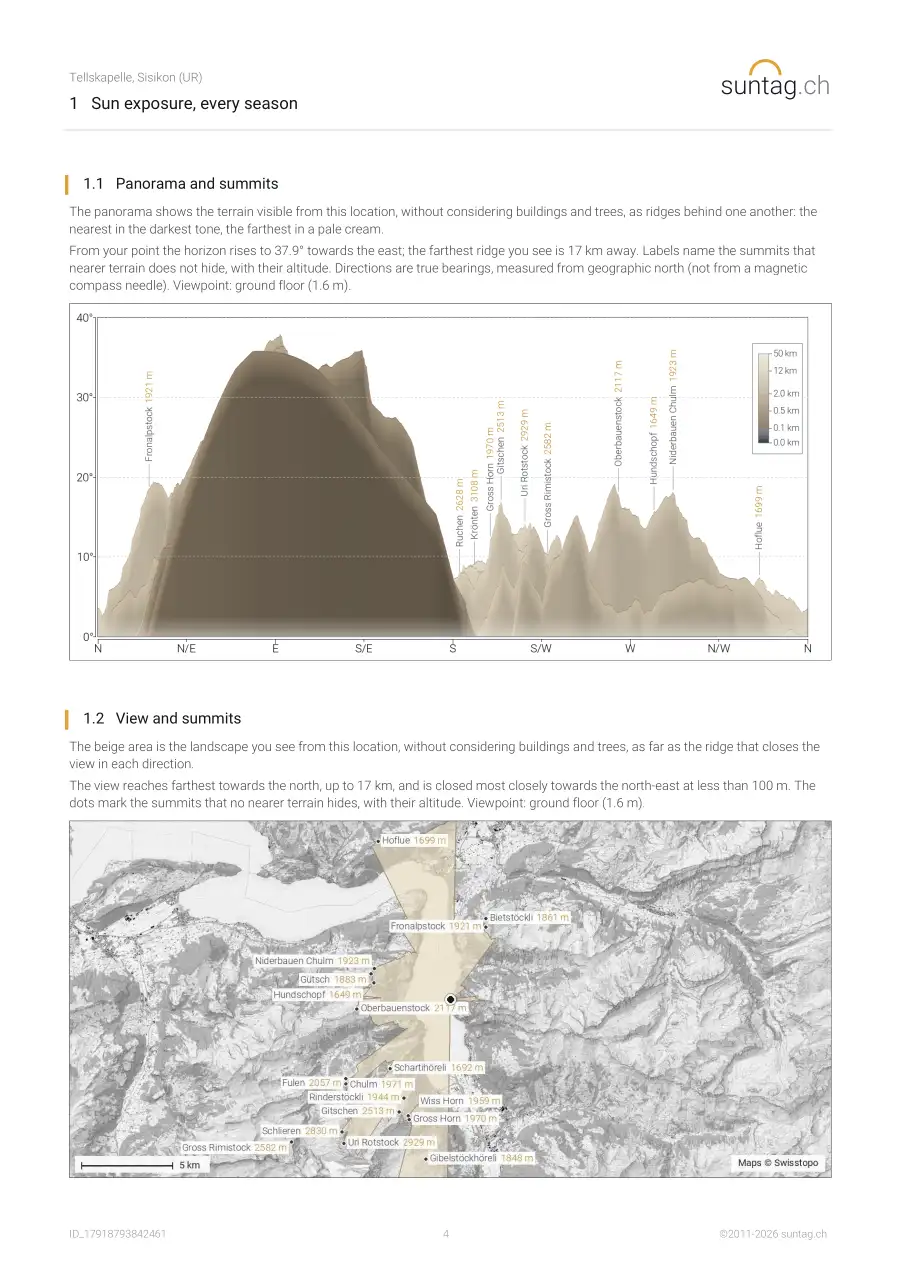
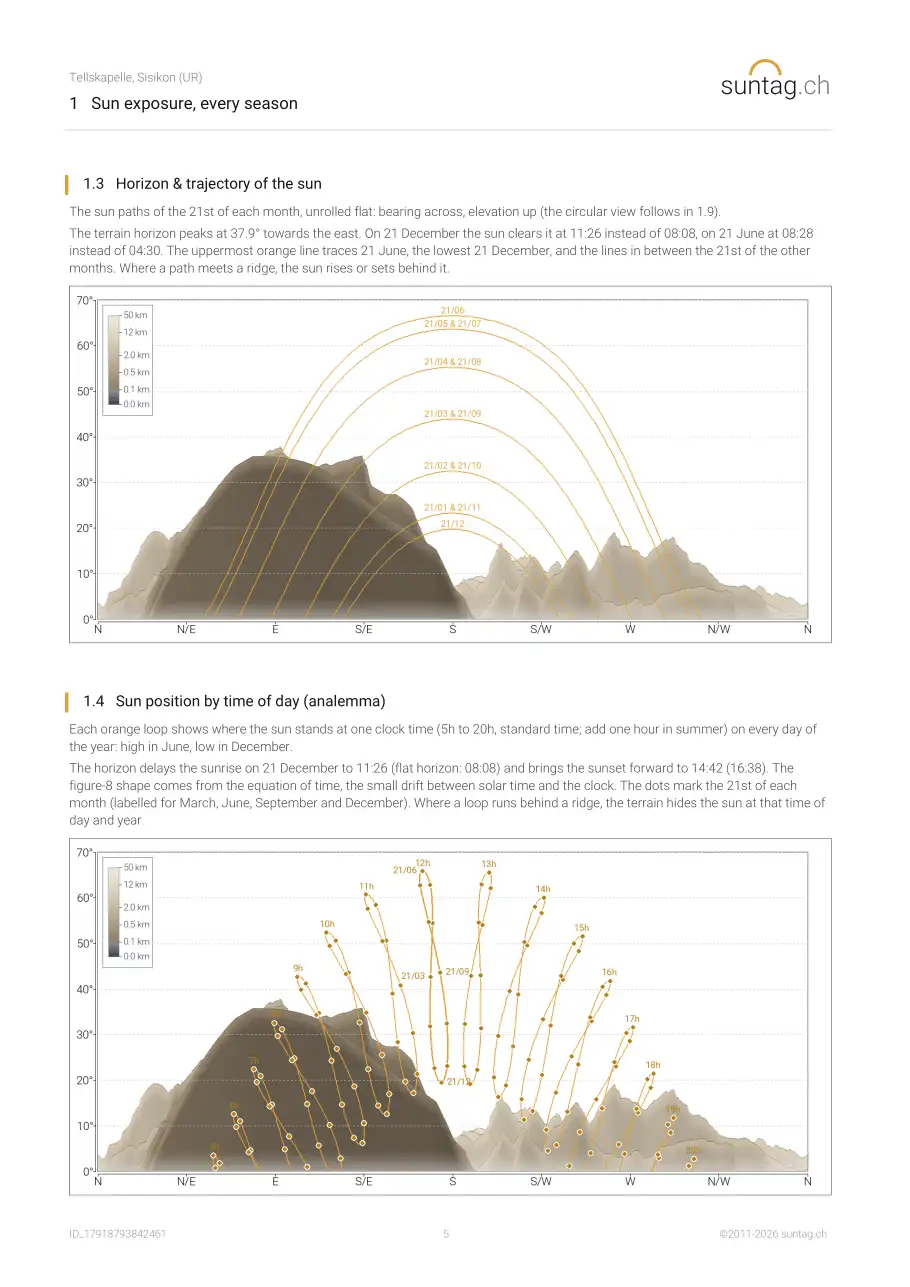
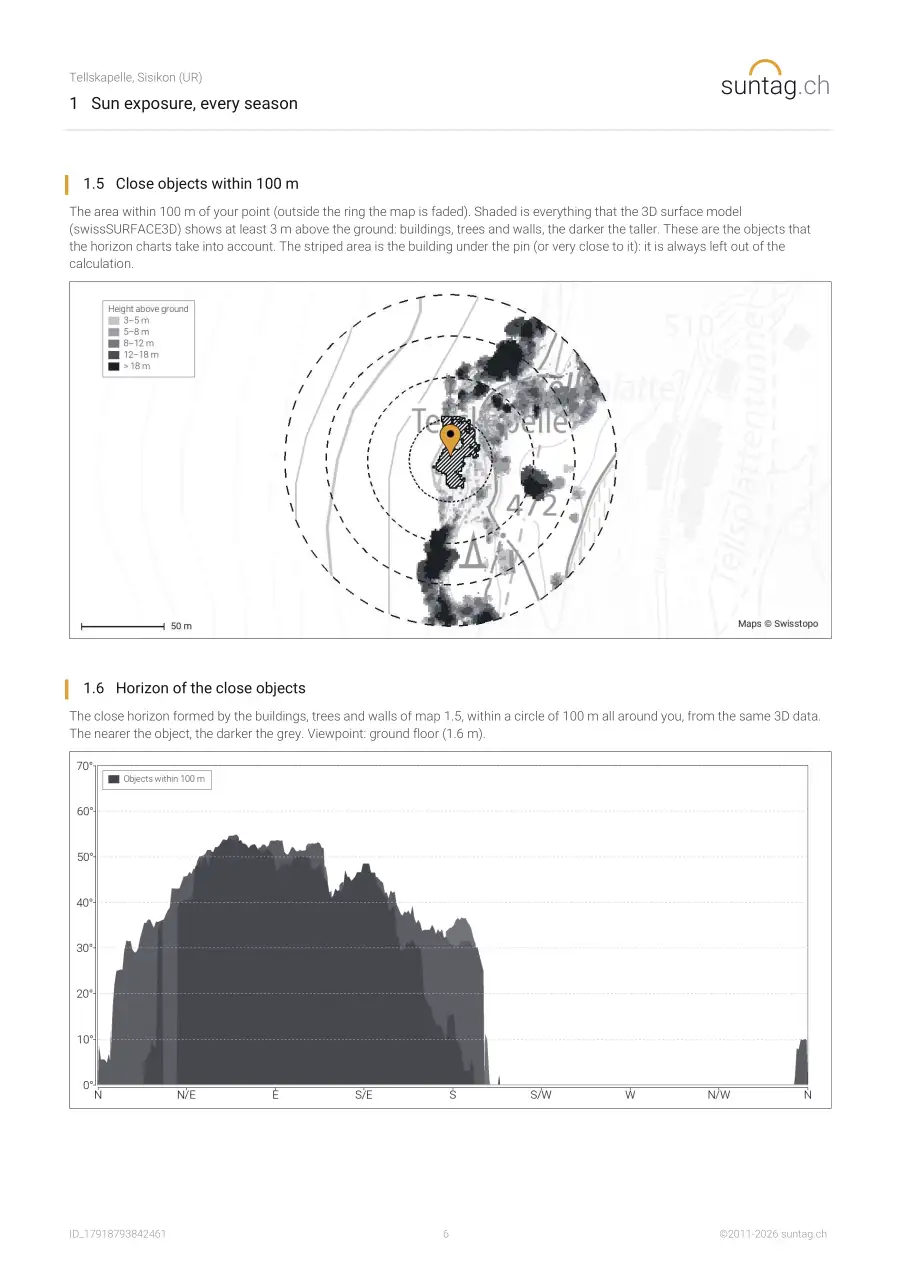
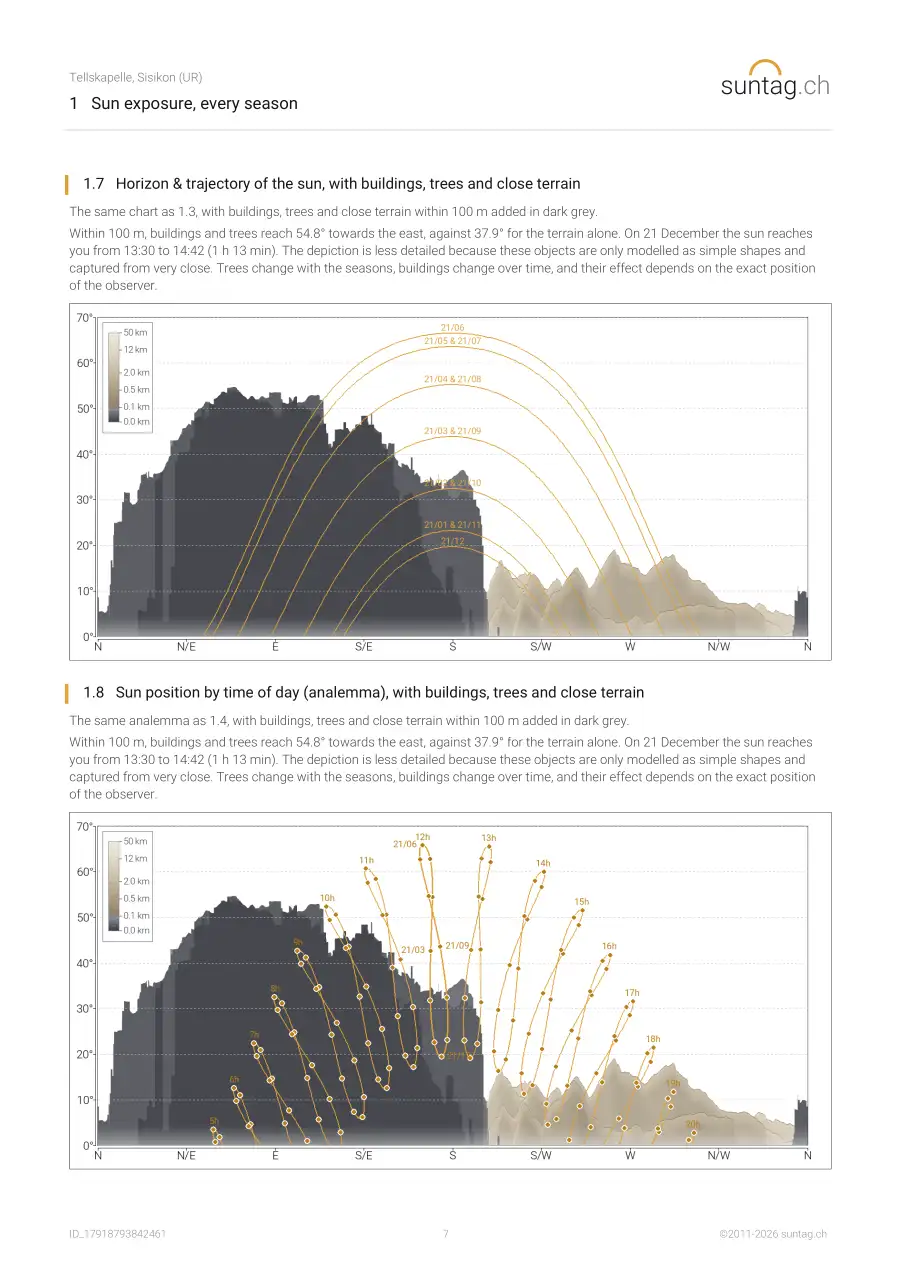
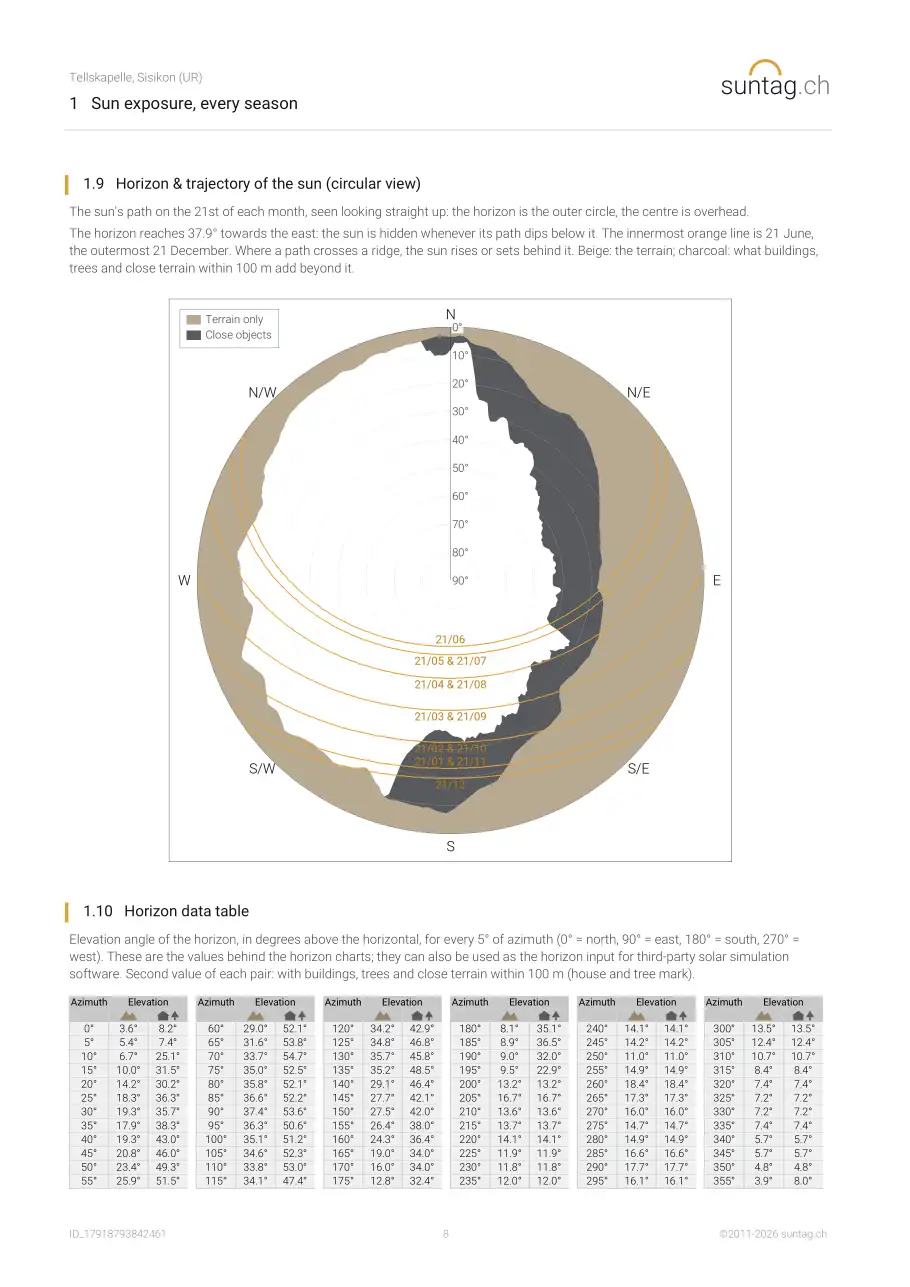
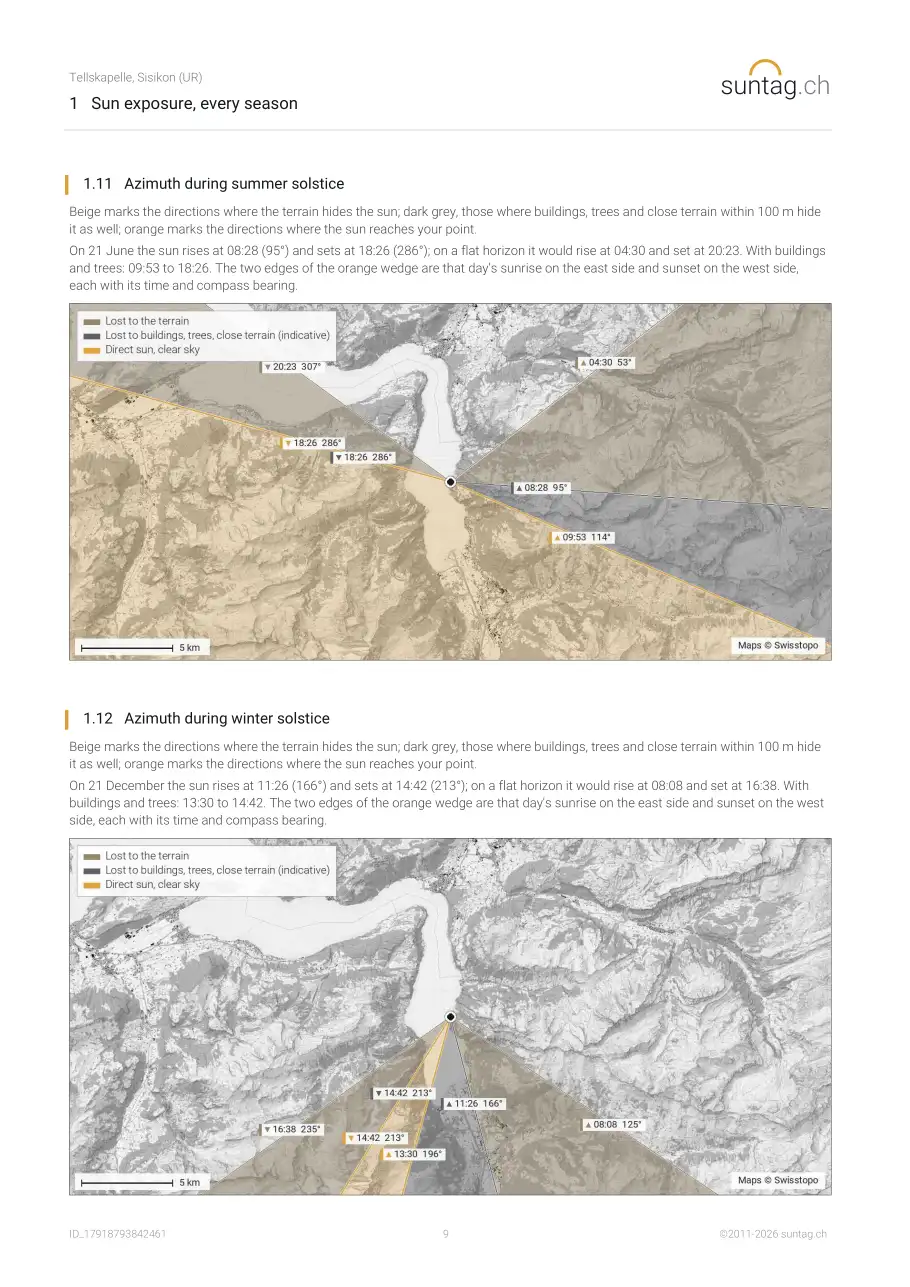
From a digital terrain model of Switzerland – a 25-metre elevation grid published by swisstopo – combined with the sun's exact path through the sky across the whole year. For your point, suntag.ch traces the horizon in every direction, works out the moment the sun clears each surrounding hill and mountain, and adds up the sunlit time that results. Buildings, trees and close terrain within 100 m of your point, taken from swisstopo's 0.5 m surface model, are added to the sunshine charts, the sunshine tables, the horizon and the analemma as a separate indication, shown in dark grey or as a second column. It is less precise: buildings are modelled as simple blocks, trees change with the seasons, and what is close depends on the exact position of the observer; the main figures count the terrain only. All horizons, with or without buildings, trees and close terrain, are calculated for an eye height of 1.6 m above the ground at the chosen point, also when the point lies on a building. The building the point stands on is left out of the version with buildings, whereas a neighbouring building appears there as an obstruction.
What does the report not take into account?
Trees and vegetation, buildings and other structures, and any construction – existing, planned or built after the report is generated. The terrain model deliberately excludes trees and buildings, so the analysis reflects the shape of the land itself, not what's built or growing on it. Weather and air quality aren't modelled either. All figures are estimates and can differ from what you experience on site. The influence of buildings and trees is strong when they are very close and can change a lot if the point is moved by only a few metres. The charts and tables therefore show it separately, within 100 m, as a less precise indication on top of the terrain-based values.
How accurate is it?
The terrain data and the sun-path calculation are exact. How closely the report matches what you'll actually see depends on what forms the horizon at your location: where it's hills and mountains, the report captures it well; where it's a neighbouring building or a row of trees, it can't – those aren't in the terrain model. Open, rural locations track reality more closely than dense urban ones. To judge a nearby building or tree, look at the horizon and analemma charts that include them; they help you estimate the effect, but it is not reflected in the sunshine figures. Objects very close to the point have a strong influence, and the result can change a lot if the point is moved by only a few metres.
Can I use it to decide whether to buy, rent or build somewhere?
It's a useful input, not a verdict. The report is general information – not a survey, an expert opinion, or architectural, legal or financial advice – and shouldn't be the sole basis for a decision. Use it to compare locations side by side, catch an obvious problem early, or walk into a viewing with the right questions already in hand.
Can I use it to plan solar panels?
Yes. Alongside showing how sunny a spot is, suntag.ch maps the exact horizon around it – precisely the shading input a solar-yield calculator needs to estimate what a panel installation at that location would actually produce.
Does the report show where mobile phone antennas are?
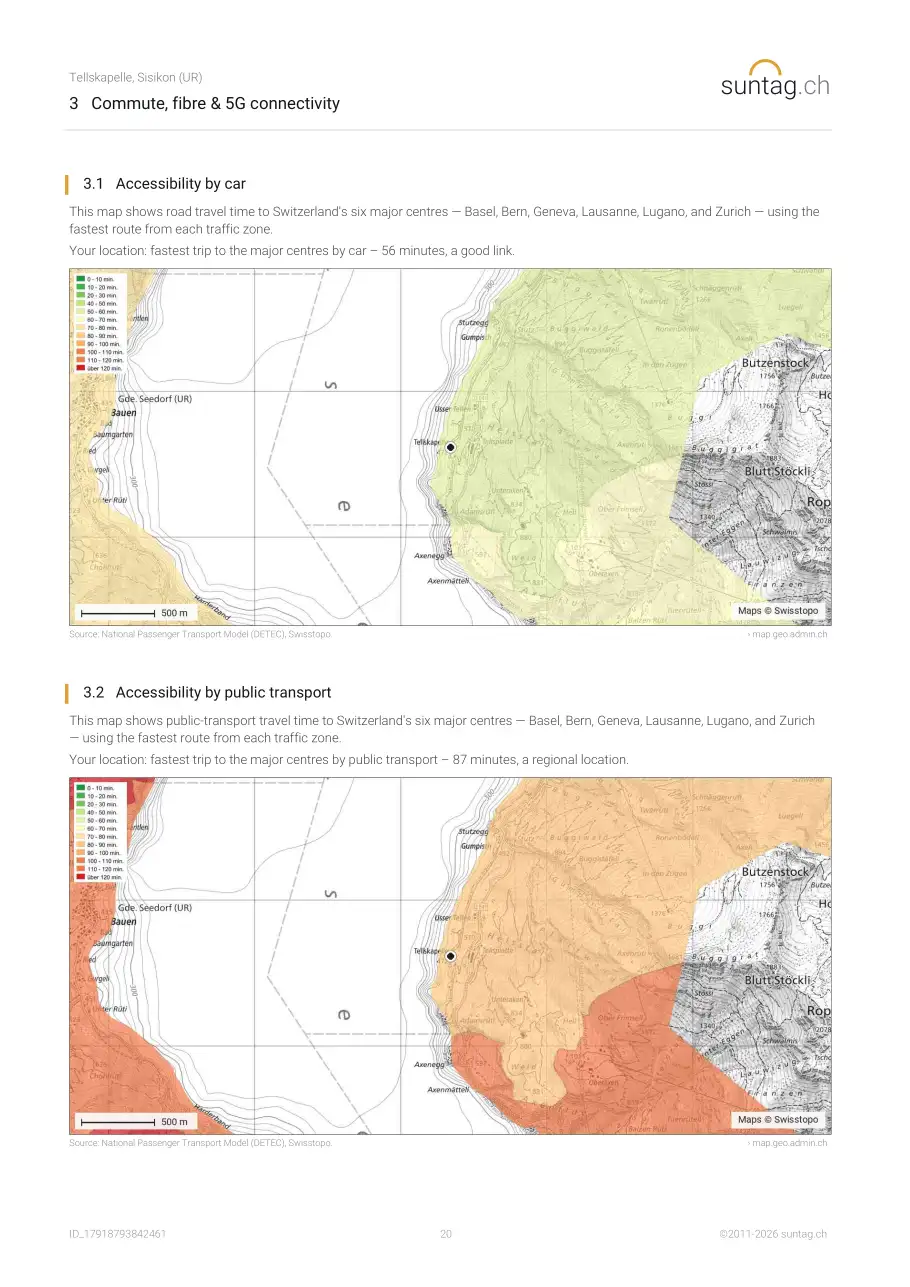
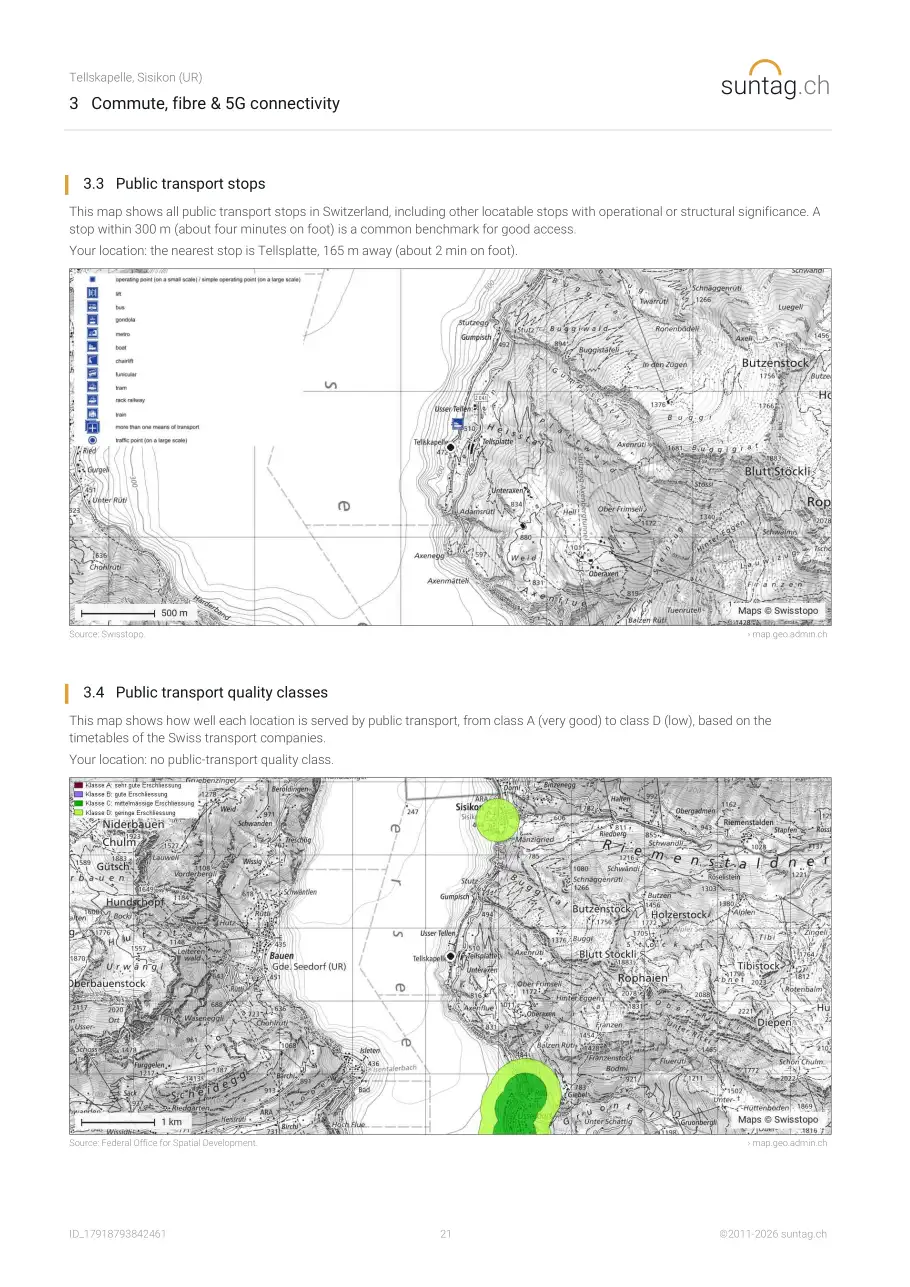
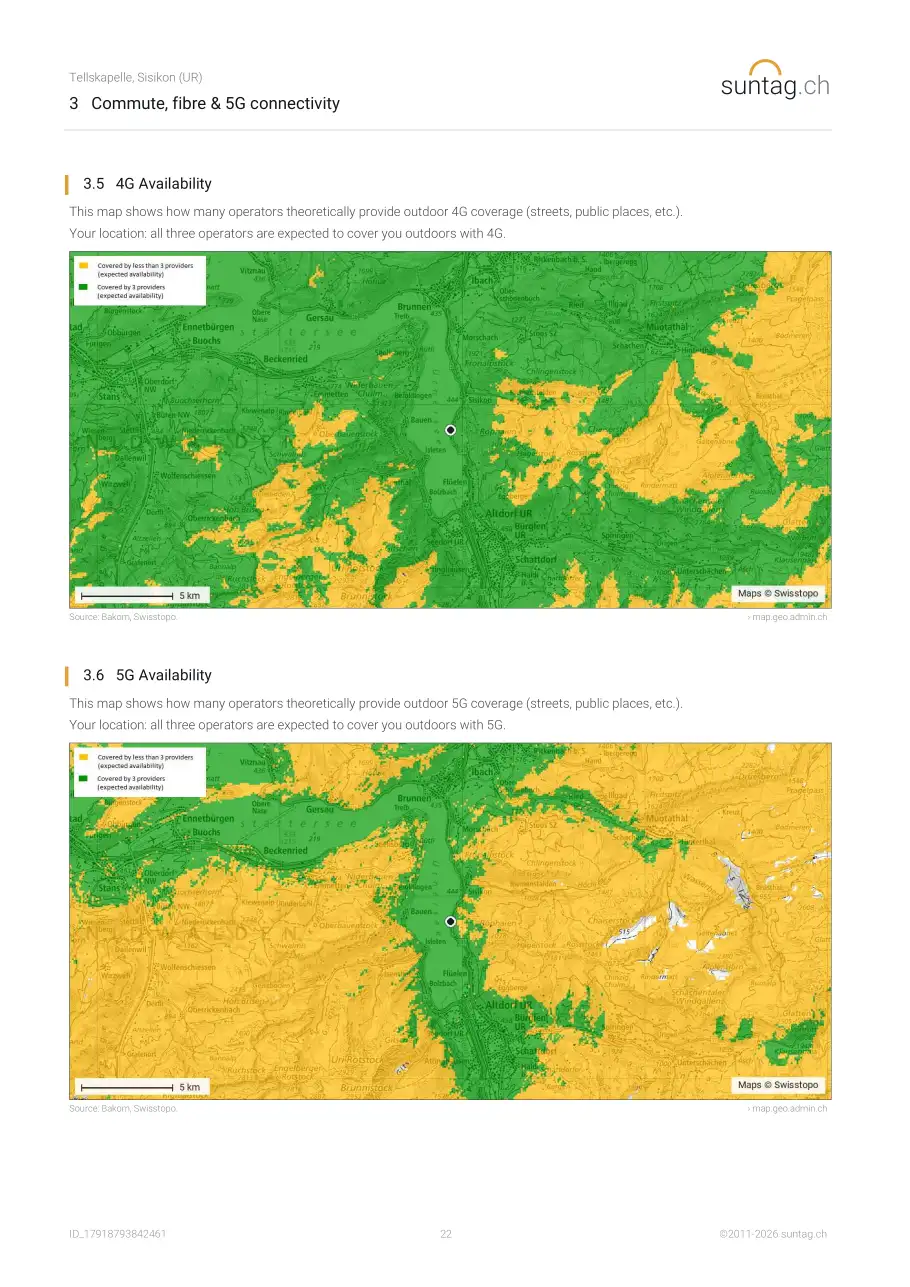
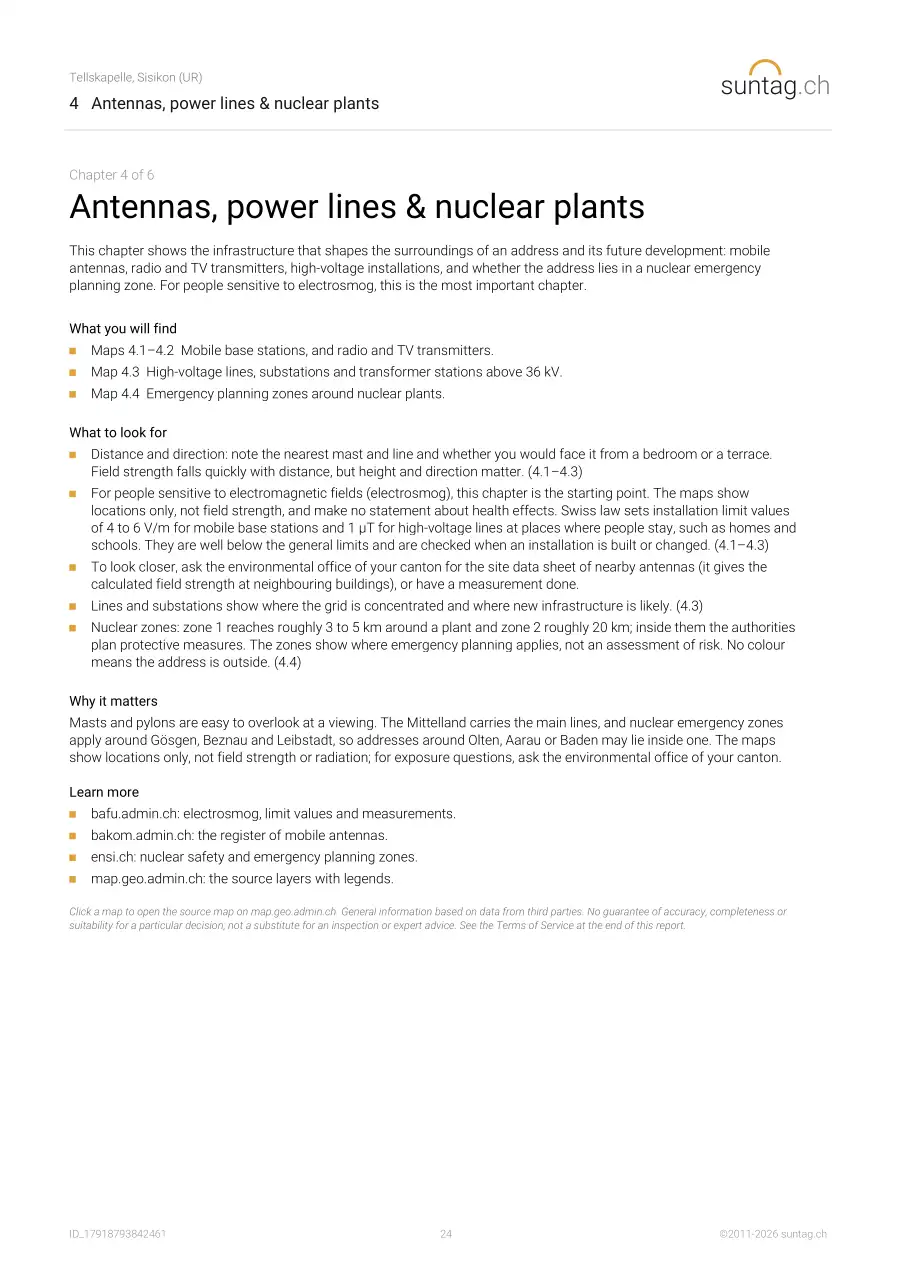
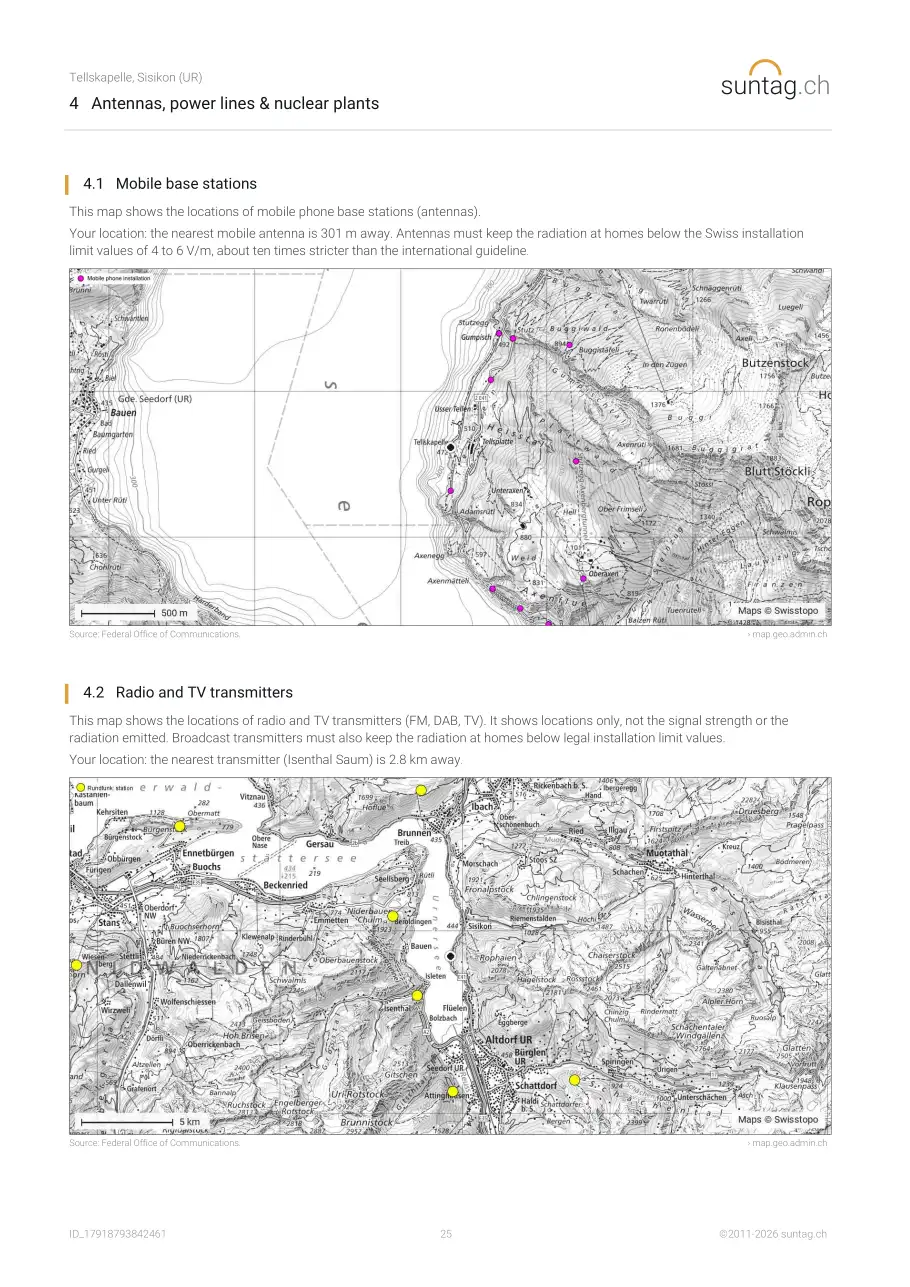
Yes. Besides 4G and 5G coverage, the report maps the locations of mobile phone base stations around your address, alongside travel times by car and public transport and the public-transport stops. So you see not only whether the signal is good, but where the nearest masts actually stand – something a viewing rarely tells you. The data comes from the Federal Office of Communications (BAKOM).